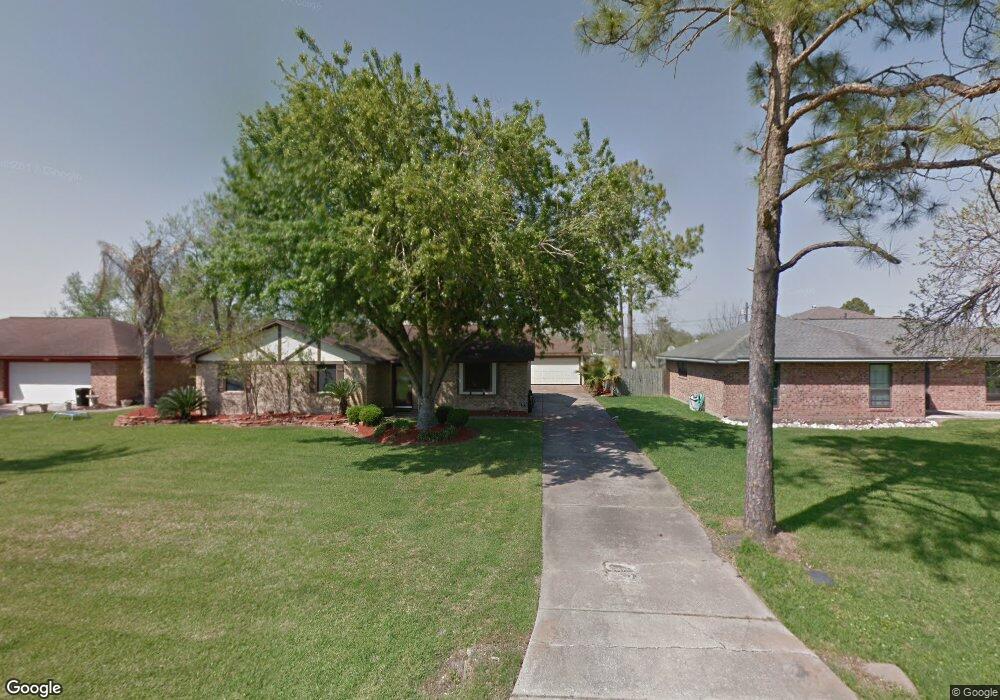
6505 Grace Ln Pearland, TX 77584
Estimated Value: $337,296 - $395,000
--
Bed
2
Baths
1,768
Sq Ft
$203/Sq Ft
Est. Value
About This Home
This home is located at 6505 Grace Ln, Pearland, TX 77584 and is currently estimated at $359,074, approximately $203 per square foot. 6505 Grace Ln is a home located in Brazoria County with nearby schools including Magnolia Elementary School, Pearland Junior High School South, and Sam Jamison Middle School.
Ownership History
Date
Name
Owned For
Owner Type
Purchase Details
Closed on
Jun 30, 2006
Sold by
Oliver Bryan Daniel and Oliver Tammy Rena
Bought by
Burleigh Clint and Burleigh Jamie
Current Estimated Value
Home Financials for this Owner
Home Financials are based on the most recent Mortgage that was taken out on this home.
Original Mortgage
$145,000
Outstanding Balance
$86,178
Interest Rate
6.67%
Mortgage Type
Purchase Money Mortgage
Estimated Equity
$272,896
Purchase Details
Closed on
Aug 17, 1995
Sold by
Murphy Edward J and Murphy Angela F
Bought by
Oliver Bryan Daniel and Oliver Tammy Rena
Home Financials for this Owner
Home Financials are based on the most recent Mortgage that was taken out on this home.
Original Mortgage
$71,750
Interest Rate
7.39%
Create a Home Valuation Report for This Property
The Home Valuation Report is an in-depth analysis detailing your home's value as well as a comparison with similar homes in the area
Home Values in the Area
Average Home Value in this Area
Purchase History
| Date | Buyer | Sale Price | Title Company |
|---|---|---|---|
| Burleigh Clint | -- | United Title Of Texas | |
| Oliver Bryan Daniel | -- | South Land Title Company |
Source: Public Records
Mortgage History
| Date | Status | Borrower | Loan Amount |
|---|---|---|---|
| Open | Burleigh Clint | $145,000 | |
| Previous Owner | Oliver Bryan Daniel | $71,750 |
Source: Public Records
Tax History Compared to Growth
Tax History
| Year | Tax Paid | Tax Assessment Tax Assessment Total Assessment is a certain percentage of the fair market value that is determined by local assessors to be the total taxable value of land and additions on the property. | Land | Improvement |
|---|---|---|---|---|
| 2025 | $2,090 | $226,270 | $68,740 | $275,170 |
| 2023 | $2,090 | $187,000 | $79,320 | $285,560 |
| 2022 | $3,199 | $170,000 | $51,130 | $118,870 |
| 2021 | $3,069 | $177,700 | $28,560 | $149,140 |
| 2020 | $2,791 | $151,700 | $22,030 | $129,670 |
| 2019 | $2,579 | $129,640 | $22,030 | $107,610 |
| 2018 | $2,595 | $129,640 | $22,030 | $107,610 |
| 2017 | $2,885 | $142,910 | $23,870 | $119,040 |
| 2016 | $2,625 | $130,000 | $14,320 | $115,680 |
| 2015 | $2,374 | $128,400 | $12,240 | $116,160 |
| 2014 | $2,374 | $133,480 | $13,460 | $120,020 |
Source: Public Records
Map
Nearby Homes
- 6436 Grace Ln
- 16708 N Wayne Ln
- 5806 Wilton St
- 3834 Aubrell Rd
- 5101 Big Spring Dr
- 16622 Mclean Rd
- 3902 Basil Ct
- 16719 Mclean Rd
- 5205 Spring Branch Dr
- 3730 Aubrell Rd
- 4009 Ravencrest Ct
- 7206 Williams Rd
- 3911 Spring Garden Dr
- 4013 Ivywood Dr
- 7223 Libby Ln
- 17115 County Road 831
- 7225 Libby Ln
- 3602 Lindhaven Dr
- 3910 Greenwood Dr
- 4015 Cedarwood Dr
- 6509 Grace Ln
- 6501 Grace Ln
- 6429 Grace Ln
- 6513 Grace Ln
- 6519 Grace Ln
- 6423 Grace Ln
- 6423 Grace St
- 16711 N Wayne Ln
- 16711 N Wayne Ln Unit 2
- 16711 N Wayne Ln Unit 5
- 16711 N Wayne Ln Unit 1
- 16711 N Wayne Ln Unit 3
- 6502 Grace Ln
- 6419 Grace Ln
- 6615 Grace Ln Unit C
- 6432 Grace Ln
- 6609 Grace Ln
- 6411 Grace Ln
- 6424 Grace Ln
- 6405 Grace Ln