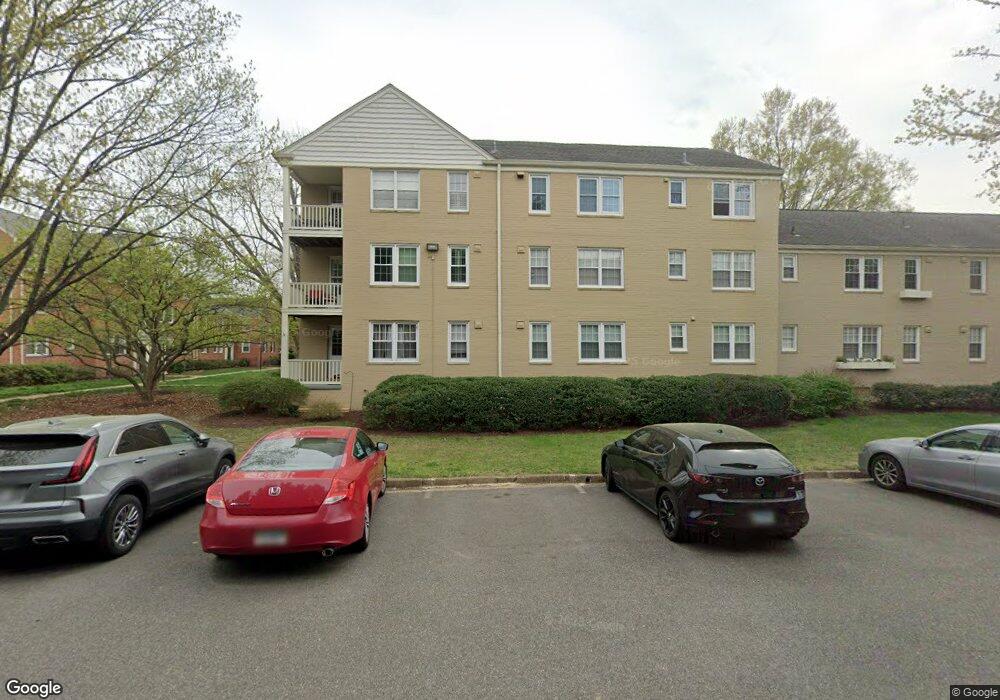
6505 Potomac Ave Unit B2 Alexandria, VA 22307
Belle Haven NeighborhoodEstimated Value: $319,000 - $354,000
2
Beds
1
Bath
785
Sq Ft
$427/Sq Ft
Est. Value
About This Home
This home is located at 6505 Potomac Ave Unit B2, Alexandria, VA 22307 and is currently estimated at $335,298, approximately $427 per square foot. 6505 Potomac Ave Unit B2 is a home located in Fairfax County with nearby schools including Belle View Elementary School, Sandburg Middle, and West Potomac High School.
Ownership History
Date
Name
Owned For
Owner Type
Purchase Details
Closed on
Mar 24, 2006
Sold by
Beighley S Robert
Bought by
Bucuvalas Dean
Current Estimated Value
Home Financials for this Owner
Home Financials are based on the most recent Mortgage that was taken out on this home.
Original Mortgage
$235,200
Outstanding Balance
$133,788
Interest Rate
6.28%
Mortgage Type
New Conventional
Estimated Equity
$201,510
Purchase Details
Closed on
May 27, 2004
Sold by
Robertson Sarah V
Bought by
Beighley S Robert and Anderson,Michelle L
Home Financials for this Owner
Home Financials are based on the most recent Mortgage that was taken out on this home.
Original Mortgage
$192,000
Interest Rate
5.88%
Mortgage Type
New Conventional
Purchase Details
Closed on
Aug 28, 2000
Sold by
Cave Janet P
Bought by
Robertson Sarah V
Create a Home Valuation Report for This Property
The Home Valuation Report is an in-depth analysis detailing your home's value as well as a comparison with similar homes in the area
Home Values in the Area
Average Home Value in this Area
Purchase History
| Date | Buyer | Sale Price | Title Company |
|---|---|---|---|
| Bucuvalas Dean | $303,000 | -- | |
| Beighley S Robert | $240,000 | -- | |
| Robertson Sarah V | $110,000 | -- |
Source: Public Records
Mortgage History
| Date | Status | Borrower | Loan Amount |
|---|---|---|---|
| Open | Bucuvalas Dean | $235,200 | |
| Previous Owner | Beighley S Robert | $192,000 |
Source: Public Records
Tax History Compared to Growth
Tax History
| Year | Tax Paid | Tax Assessment Tax Assessment Total Assessment is a certain percentage of the fair market value that is determined by local assessors to be the total taxable value of land and additions on the property. | Land | Improvement |
|---|---|---|---|---|
| 2025 | $3,336 | $311,000 | $62,000 | $249,000 |
| 2024 | $3,336 | $287,960 | $58,000 | $229,960 |
| 2023 | $3,155 | $279,570 | $56,000 | $223,570 |
| 2022 | $3,365 | $294,280 | $59,000 | $235,280 |
| 2021 | $3,321 | $282,960 | $57,000 | $225,960 |
| 2020 | $3,159 | $266,940 | $53,000 | $213,940 |
| 2019 | $2,849 | $240,740 | $48,000 | $192,740 |
| 2018 | $2,662 | $231,480 | $46,000 | $185,480 |
| 2017 | $2,581 | $222,350 | $44,000 | $178,350 |
| 2016 | $2,651 | $228,840 | $46,000 | $182,840 |
| 2015 | $2,504 | $224,350 | $45,000 | $179,350 |
| 2014 | $2,807 | $252,080 | $50,000 | $202,080 |
Source: Public Records
Map
Nearby Homes
- 6509 Potomac Ave Unit A2
- 6514 10th St
- 1403 Belle View Blvd Unit B-1
- 1107 Belle View Blvd Unit A1
- 1411 Belle View Blvd Unit B1
- 6613 E Wakefield Dr Unit A1
- 6608 Potomac Ave Unit B2
- 6402 Potomac Ave
- 6430 14th St
- 6625 10th St Unit C2
- 6621 Wakefield Dr Unit 418
- 6621 Wakefield Dr Unit 910
- 6631 Wakefield Dr Unit 819
- 6631 Wakefield Dr Unit 106
- 6641 Wakefield Dr Unit 616
- 6641 Wakefield Dr Unit 801
- 6641 Wakefield Dr Unit 317
- 6641 Wakefield Dr Unit 918
- 6641 Wakefield Dr Unit 506
- 6641 Wakefield Dr Unit 405
- 6505 Potomac Ave Unit B1
- 6505 Potomac Ave Unit A1
- 6505 Potomac Ave Unit A2
- 6503 Potomac Ave Unit B2
- 6503 Potomac Ave Unit B1
- 6503 Potomac Ave Unit A2
- 6503 Potomac Ave Unit A1
- 1111-B I St
- 6517 Potomac Ave Unit B2
- 6517 Potomac Ave Unit J
- 6517 Potomac Ave Unit J1
- 6517 Potomac Ave Unit J
- 6517 Potomac Ave Unit A1
- 6517 Potomac Ave Unit B1
- 6501 Potomac Ave Unit A1
- 6501 Potomac Ave Unit A2
- 6501 Potomac Ave Unit B2
- 6501 Potomac Ave Unit A
- 6501 Potomac Ave Unit B1
- 1111 I St Unit 2