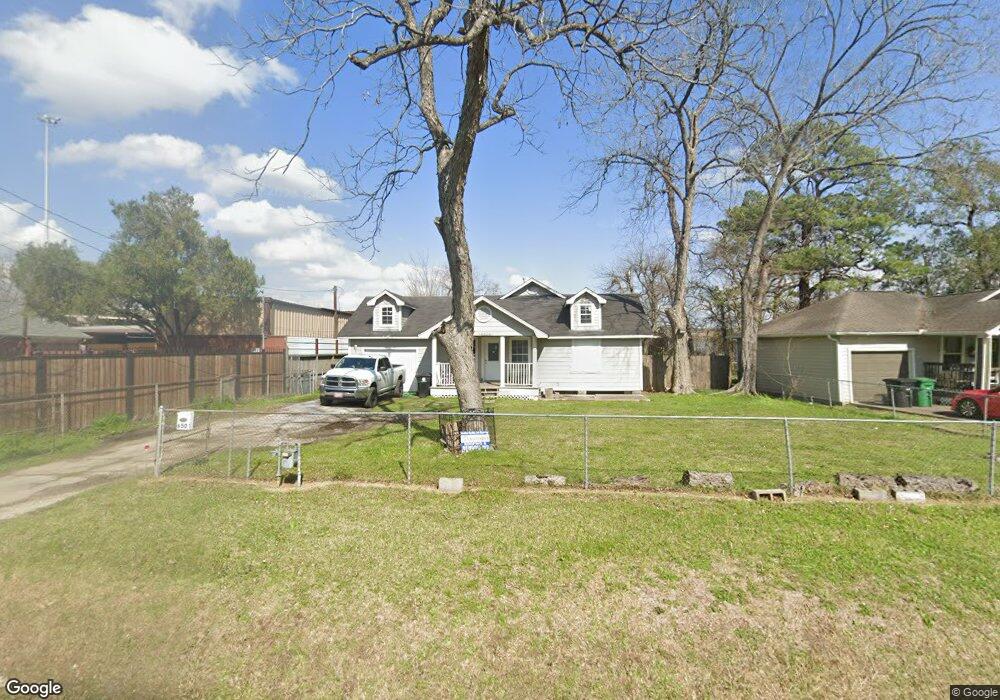
6506 Frisco St Houston, TX 77022
Northside-Northline NeighborhoodEstimated Value: $222,928 - $340,000
3
Beds
2
Baths
1,152
Sq Ft
$247/Sq Ft
Est. Value
About This Home
This home is located at 6506 Frisco St, Houston, TX 77022 and is currently estimated at $283,982, approximately $246 per square foot. 6506 Frisco St is a home located in Harris County with nearby schools including Roosevelt Elementary School, Burbank Middle School, and Northside High School.
Ownership History
Date
Name
Owned For
Owner Type
Purchase Details
Closed on
Feb 12, 2021
Sold by
Luisa Sanchez Maria
Bought by
Inclan Robert M
Current Estimated Value
Purchase Details
Closed on
Aug 31, 2001
Sold by
Montemayor Santiago V and Montemayor Ernestina D
Bought by
Inclan Ramon G and Inclan Maria L
Home Financials for this Owner
Home Financials are based on the most recent Mortgage that was taken out on this home.
Original Mortgage
$73,995
Interest Rate
6.98%
Mortgage Type
Construction
Purchase Details
Closed on
Dec 11, 2000
Sold by
Montemayor Santiago V and Montemayor Sabtuagi V
Bought by
48 Hour Funding Llc
Create a Home Valuation Report for This Property
The Home Valuation Report is an in-depth analysis detailing your home's value as well as a comparison with similar homes in the area
Home Values in the Area
Average Home Value in this Area
Purchase History
| Date | Buyer | Sale Price | Title Company |
|---|---|---|---|
| Inclan Robert M | -- | Laird Law Firm Pc | |
| Inclan Ramon G | -- | -- | |
| 48 Hour Funding Llc | $105,000 | -- |
Source: Public Records
Mortgage History
| Date | Status | Borrower | Loan Amount |
|---|---|---|---|
| Previous Owner | Inclan Ramon G | $73,995 |
Source: Public Records
Tax History Compared to Growth
Tax History
| Year | Tax Paid | Tax Assessment Tax Assessment Total Assessment is a certain percentage of the fair market value that is determined by local assessors to be the total taxable value of land and additions on the property. | Land | Improvement |
|---|---|---|---|---|
| 2025 | $3,884 | $239,670 | $169,439 | $70,231 |
| 2024 | $3,884 | $185,616 | $84,720 | $100,896 |
| 2023 | $3,884 | $185,616 | $84,720 | $100,896 |
| 2022 | $3,506 | $159,223 | $84,720 | $74,503 |
| 2021 | $3,430 | $142,943 | $84,720 | $58,223 |
| 2020 | $3,461 | $142,943 | $84,720 | $58,223 |
| 2019 | $3,617 | $142,943 | $84,720 | $58,223 |
| 2018 | $3,214 | $127,032 | $84,720 | $42,312 |
| 2017 | $3,212 | $127,032 | $84,720 | $42,312 |
| 2016 | $3,212 | $127,032 | $84,720 | $42,312 |
| 2015 | $1,906 | $88,337 | $44,477 | $43,860 |
| 2014 | $1,906 | $74,140 | $44,477 | $29,663 |
Source: Public Records
Map
Nearby Homes