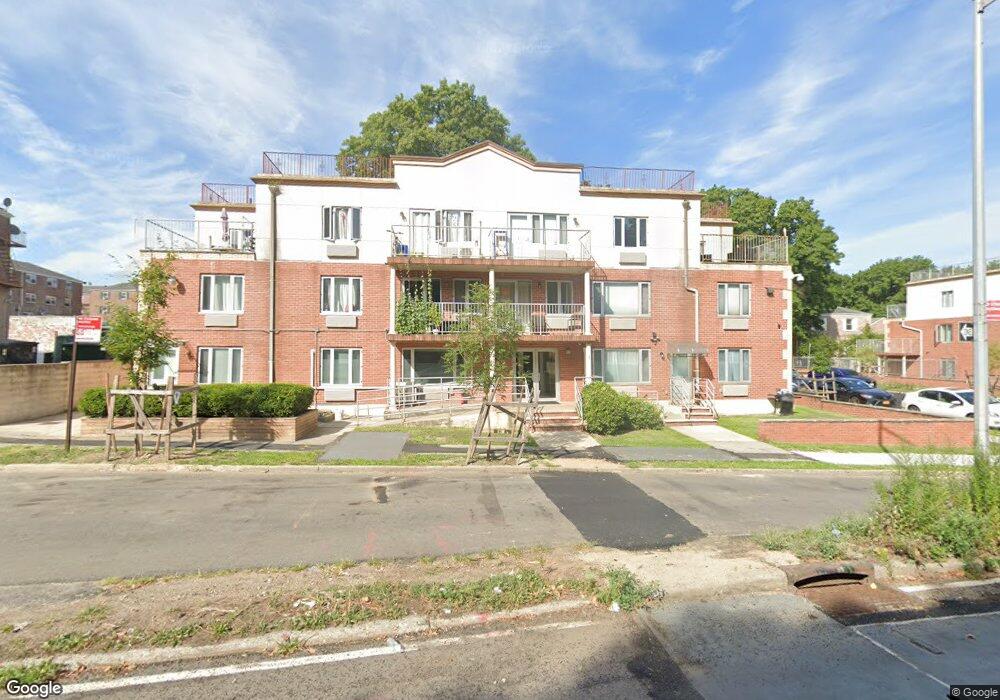
6506 Grand Central Pkwy Unit 2D Forest Hills, NY 11375
Forest Hills NeighborhoodEstimated Value: $280,000 - $433,000
--
Bed
--
Bath
539
Sq Ft
$706/Sq Ft
Est. Value
About This Home
This home is located at 6506 Grand Central Pkwy Unit 2D, Forest Hills, NY 11375 and is currently estimated at $380,724, approximately $706 per square foot. 6506 Grand Central Pkwy Unit 2D is a home located in Queens County with nearby schools including P.S. 175 - The Lynn Gross Discovery School, Stephen A. Halsey JHS 157, and Forest Hills High School.
Ownership History
Date
Name
Owned For
Owner Type
Purchase Details
Closed on
Dec 16, 2021
Sold by
He Jim and Weng Zimei
Bought by
Duong Nga Thy
Current Estimated Value
Home Financials for this Owner
Home Financials are based on the most recent Mortgage that was taken out on this home.
Original Mortgage
$304,000
Outstanding Balance
$279,600
Interest Rate
3.11%
Mortgage Type
Purchase Money Mortgage
Estimated Equity
$101,124
Purchase Details
Closed on
Oct 19, 2017
Sold by
Space2living Inc
Bought by
He Jim and Weng Zimei
Home Financials for this Owner
Home Financials are based on the most recent Mortgage that was taken out on this home.
Original Mortgage
$307,500
Interest Rate
3.78%
Mortgage Type
Purchase Money Mortgage
Purchase Details
Closed on
Jul 9, 2014
Sold by
Brisam Forest Hills Llc
Bought by
Space2living Inc
Create a Home Valuation Report for This Property
The Home Valuation Report is an in-depth analysis detailing your home's value as well as a comparison with similar homes in the area
Home Values in the Area
Average Home Value in this Area
Purchase History
| Date | Buyer | Sale Price | Title Company |
|---|---|---|---|
| Duong Nga Thy | $435,000 | -- | |
| He Jim | $410,000 | -- | |
| Space2living Inc | $199,386 | -- |
Source: Public Records
Mortgage History
| Date | Status | Borrower | Loan Amount |
|---|---|---|---|
| Open | Duong Nga Thy | $304,000 | |
| Previous Owner | He Jim | $307,500 |
Source: Public Records
Tax History Compared to Growth
Tax History
| Year | Tax Paid | Tax Assessment Tax Assessment Total Assessment is a certain percentage of the fair market value that is determined by local assessors to be the total taxable value of land and additions on the property. | Land | Improvement |
|---|---|---|---|---|
| 2025 | $4,200 | $32,036 | $10,317 | $21,719 |
| 2024 | $3,465 | $33,594 | $10,317 | $23,277 |
| 2023 | $4,217 | $33,730 | $10,317 | $23,413 |
| 2022 | $3,257 | $33,100 | $10,317 | $22,783 |
| 2021 | $2,290 | $30,654 | $10,317 | $20,337 |
| 2020 | $1,706 | $35,264 | $10,317 | $24,947 |
| 2019 | $882 | $35,501 | $10,317 | $25,184 |
| 2018 | $87 | $30,919 | $10,316 | $20,603 |
| 2017 | $87 | $29,515 | $10,317 | $19,198 |
| 2016 | $88 | $29,515 | $10,317 | $19,198 |
| 2015 | -- | $29,502 | $10,316 | $19,186 |
| 2014 | -- | $29,336 | $10,317 | $19,019 |
Source: Public Records
Map
Nearby Homes
- 65-06 Grand Central Pkwy Unit 1 C
- 65-06 Grand Central Pkwy Unit 2E
- 6434 Grand Central Pkwy Unit 1F
- 64-34 Grand Central Pkwy Unit 1B
- 64-34 Grand Central Pkwy Unit 1E
- 64-34 Grand Central Pkwy Unit 3D
- 110-25 64th Rd Unit 10
- 111-16 66th Ave Unit 3
- 110-17 64th Ave
- 66-10 110th St Unit 3B
- 10841 64th Rd
- 63-64 110th St
- 10811 65th Rd
- 10817 66th Ave
- 108-17 66ave
- 10807 65th Rd Unit 1C
- 65-39 108th St Unit E-10
- 65-39 108th St Unit E6
- 6535 108th St Unit B7
- 108-34 63rd Dr
- 6506 Grand Central Pkwy
- 65-06 Grand Central Pkwy Unit 3D
- 65-06 Grand Central Pkwy Unit 1D
- 65-06 Grand Central Pkwy
- 65-06 Grand Central Pkwy Unit 3C
- 65-06 Grand Central Pkwy Unit 2D
- 6506 Grand Central Pkwy Unit 3A
- 6506 Grand Central Pkwy Unit 2E
- 6506 Grand Central Pkwy Unit 1D
- 6506 Grand Central Pkwy Unit 2B
- 6506 Grand Central Pkwy Unit 1C
- 6506 Grand Central Pkwy Unit 3D
- 6506 Grand Central Pkwy Unit 3B
- 6506 Grand Central Pkwy Unit 2A
- 6506 Grand Central Pkwy Unit 2C
- 6506 Grand Central Pkwy Unit 1B
- 6506 Grand Central Pkwy Unit 1A
- 6506 Grand Central Pkwy Unit 3C
- 11056 65th Ave Unit 56
- 110-54 65th Ave