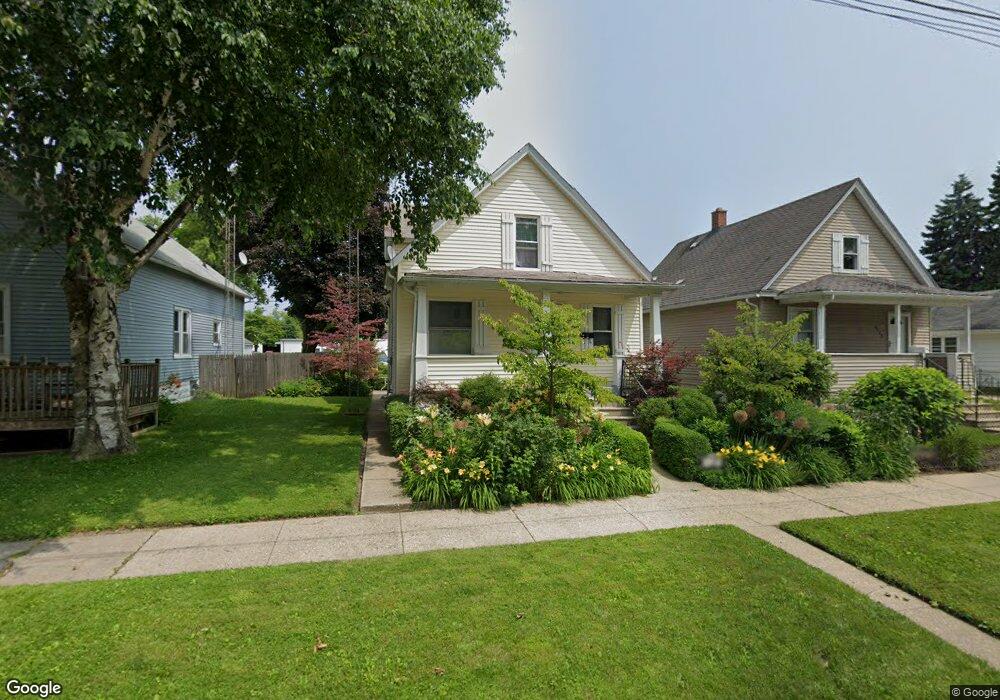
6509 28th Ave Kenosha, WI 53143
Uptown NeighborhoodEstimated Value: $187,000 - $252,000
3
Beds
2
Baths
1,045
Sq Ft
$205/Sq Ft
Est. Value
About This Home
This home is located at 6509 28th Ave, Kenosha, WI 53143 and is currently estimated at $213,792, approximately $204 per square foot. 6509 28th Ave is a home located in Kenosha County with nearby schools including Roosevelt Elementary School, Lincoln Middle School, and Indian Trail High School And Academy.
Ownership History
Date
Name
Owned For
Owner Type
Purchase Details
Closed on
Jun 21, 2005
Sold by
Brincat Jeff
Bought by
Ochoa Jose
Current Estimated Value
Home Financials for this Owner
Home Financials are based on the most recent Mortgage that was taken out on this home.
Original Mortgage
$135,000
Outstanding Balance
$72,597
Interest Rate
6.23%
Mortgage Type
Adjustable Rate Mortgage/ARM
Estimated Equity
$141,195
Create a Home Valuation Report for This Property
The Home Valuation Report is an in-depth analysis detailing your home's value as well as a comparison with similar homes in the area
Home Values in the Area
Average Home Value in this Area
Purchase History
| Date | Buyer | Sale Price | Title Company |
|---|---|---|---|
| Ochoa Jose | $150,000 | Lakeside Title & Closing Ser |
Source: Public Records
Mortgage History
| Date | Status | Borrower | Loan Amount |
|---|---|---|---|
| Open | Ochoa Jose | $135,000 |
Source: Public Records
Tax History Compared to Growth
Tax History
| Year | Tax Paid | Tax Assessment Tax Assessment Total Assessment is a certain percentage of the fair market value that is determined by local assessors to be the total taxable value of land and additions on the property. | Land | Improvement |
|---|---|---|---|---|
| 2024 | $2,270 | $100,900 | $15,300 | $85,600 |
| 2023 | $2,270 | $100,900 | $15,300 | $85,600 |
| 2022 | $2,306 | $100,900 | $15,300 | $85,600 |
| 2021 | $2,357 | $100,900 | $15,300 | $85,600 |
| 2020 | $2,456 | $100,900 | $15,300 | $85,600 |
| 2019 | $2,354 | $100,900 | $15,300 | $85,600 |
| 2018 | $2,316 | $102,600 | $20,300 | $82,300 |
| 2017 | $2,641 | $102,600 | $20,300 | $82,300 |
| 2016 | $2,707 | $102,600 | $20,300 | $82,300 |
| 2015 | $2,635 | $96,400 | $22,300 | $74,100 |
| 2014 | $2,622 | $96,400 | $22,300 | $74,100 |
Source: Public Records
Map
Nearby Homes