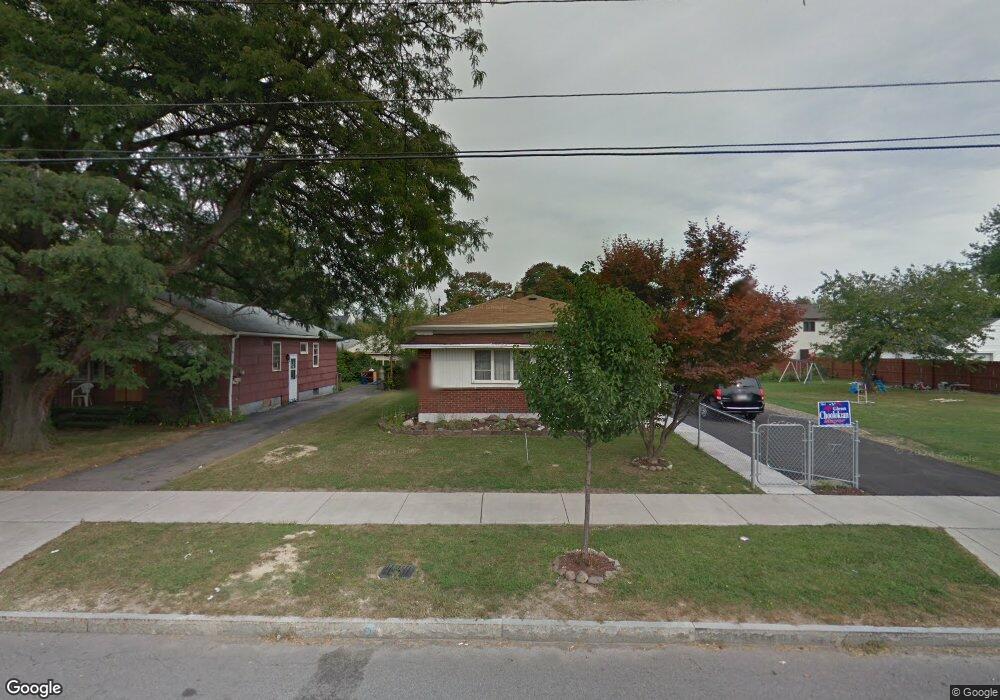
651 72nd St Niagara Falls, NY 14304
LaSalle NeighborhoodEstimated Value: $176,000 - $224,000
3
Beds
1
Bath
1,168
Sq Ft
$171/Sq Ft
Est. Value
About This Home
This home is located at 651 72nd St, Niagara Falls, NY 14304 and is currently estimated at $199,397, approximately $170 per square foot. 651 72nd St is a home located in Niagara County with nearby schools including Niagara Falls High School, Catholic Academy Of Niagara Falls - Elementary, and Christ the King Preparatory Academy.
Ownership History
Date
Name
Owned For
Owner Type
Purchase Details
Closed on
Dec 30, 2015
Sold by
Morinello Angelo
Bought by
Morinello Angelo and Morinello Morinello
Current Estimated Value
Purchase Details
Closed on
Jun 25, 2011
Sold by
U S Bank National Association
Bought by
Morinello Angelo and Morinello Christina
Purchase Details
Closed on
Sep 16, 2010
Sold by
Dekeyser Rodolfo and Dekeyser Mary Ann
Bought by
U S Bank National Association
Purchase Details
Closed on
Oct 24, 2006
Sold by
Simcox William A
Bought by
Dekeyser Rodolfo
Create a Home Valuation Report for This Property
The Home Valuation Report is an in-depth analysis detailing your home's value as well as a comparison with similar homes in the area
Home Values in the Area
Average Home Value in this Area
Purchase History
| Date | Buyer | Sale Price | Title Company |
|---|---|---|---|
| Morinello Angelo | -- | -- | |
| Morinello Angelo | $39,000 | None Available | |
| U S Bank National Association | $42,900 | None Available | |
| Dekeyser Rodolfo | $61,480 | Gregory Pope |
Source: Public Records
Tax History Compared to Growth
Tax History
| Year | Tax Paid | Tax Assessment Tax Assessment Total Assessment is a certain percentage of the fair market value that is determined by local assessors to be the total taxable value of land and additions on the property. | Land | Improvement |
|---|---|---|---|---|
| 2024 | $761 | $68,000 | $6,700 | $61,300 |
| 2023 | $761 | $68,000 | $6,700 | $61,300 |
| 2022 | $1,274 | $57,000 | $6,700 | $50,300 |
| 2021 | $1,250 | $57,000 | $6,700 | $50,300 |
| 2020 | $892 | $57,000 | $6,700 | $50,300 |
| 2019 | $987 | $57,000 | $6,700 | $50,300 |
| 2018 | $1,051 | $53,000 | $6,700 | $46,300 |
| 2017 | $987 | $53,000 | $6,700 | $46,300 |
| 2016 | $1,393 | $53,000 | $6,700 | $46,300 |
| 2015 | -- | $50,000 | $3,700 | $46,300 |
| 2014 | -- | $50,000 | $3,700 | $46,300 |
Source: Public Records
Map
Nearby Homes