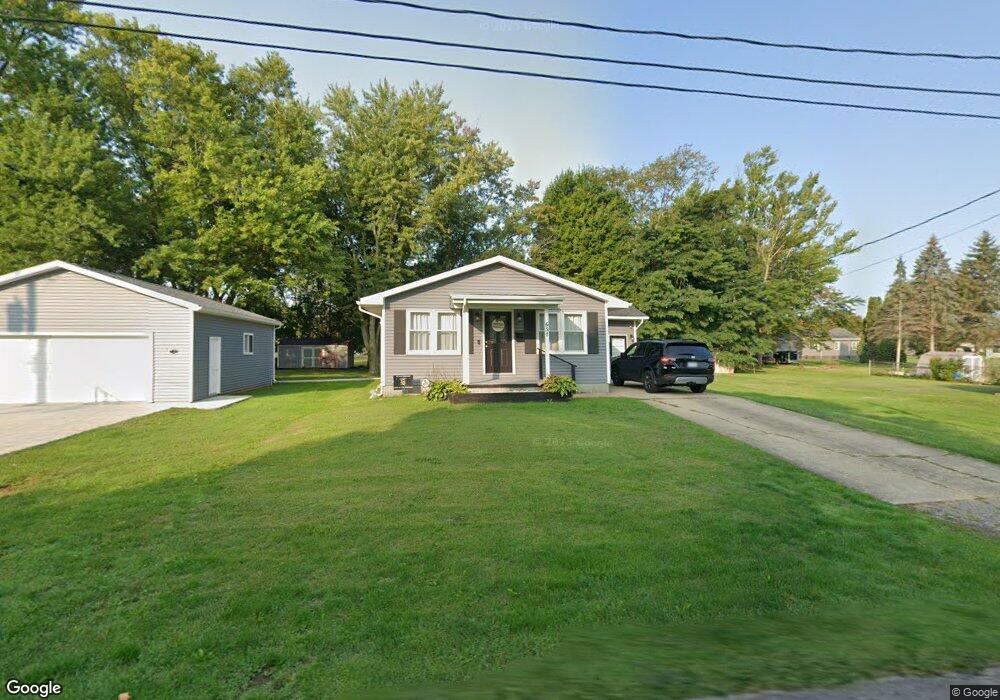
651 Baltic St Conneaut, OH 44030
Estimated Value: $152,000 - $175,000
3
Beds
2
Baths
1,056
Sq Ft
$155/Sq Ft
Est. Value
About This Home
This home is located at 651 Baltic St, Conneaut, OH 44030 and is currently estimated at $163,234, approximately $154 per square foot. 651 Baltic St is a home located in Ashtabula County with nearby schools including Lakeshore Primary Elementary School, Gateway Elementary School, and Conneaut Middle School.
Ownership History
Date
Name
Owned For
Owner Type
Purchase Details
Closed on
May 23, 2022
Sold by
Nelson Michele Lee and Nelson Robert John
Bought by
Nelson Michele Lee and Nelson Robert John
Current Estimated Value
Purchase Details
Closed on
Dec 18, 2015
Sold by
Picard Paul Thomas and Picard Karen L
Bought by
Nelson Michele Lee and Nelson Robert John
Home Financials for this Owner
Home Financials are based on the most recent Mortgage that was taken out on this home.
Original Mortgage
$58,400
Interest Rate
3.96%
Mortgage Type
New Conventional
Purchase Details
Closed on
Sep 5, 1997
Sold by
Whiteman Beverly J
Bought by
Picard Paul T and Picard Karen L
Home Financials for this Owner
Home Financials are based on the most recent Mortgage that was taken out on this home.
Original Mortgage
$51,200
Interest Rate
7.54%
Mortgage Type
New Conventional
Create a Home Valuation Report for This Property
The Home Valuation Report is an in-depth analysis detailing your home's value as well as a comparison with similar homes in the area
Home Values in the Area
Average Home Value in this Area
Purchase History
| Date | Buyer | Sale Price | Title Company |
|---|---|---|---|
| Nelson Michele Lee | -- | -- | |
| Nelson Michele Lee | $73,000 | Attorney | |
| Picard Paul T | $64,000 | -- |
Source: Public Records
Mortgage History
| Date | Status | Borrower | Loan Amount |
|---|---|---|---|
| Previous Owner | Nelson Michele Lee | $58,400 | |
| Previous Owner | Picard Paul T | $51,200 |
Source: Public Records
Tax History
| Year | Tax Paid | Tax Assessment Tax Assessment Total Assessment is a certain percentage of the fair market value that is determined by local assessors to be the total taxable value of land and additions on the property. | Land | Improvement |
|---|---|---|---|---|
| 2024 | $3,191 | $43,620 | $13,550 | $30,070 |
| 2023 | $2,025 | $43,620 | $13,550 | $30,070 |
| 2022 | $1,757 | $32,730 | $10,430 | $22,300 |
| 2021 | $1,411 | $25,800 | $3,500 | $22,300 |
| 2020 | $1,410 | $25,800 | $3,500 | $22,300 |
| 2019 | $1,210 | $21,710 | $2,980 | $18,730 |
| 2018 | $1,154 | $21,710 | $2,980 | $18,730 |
| 2017 | $1,152 | $21,710 | $2,980 | $18,730 |
| 2016 | $1,027 | $21,040 | $2,910 | $18,130 |
| 2015 | $1,037 | $21,040 | $2,910 | $18,130 |
| 2014 | $918 | $21,040 | $2,910 | $18,130 |
| 2013 | $996 | $23,490 | $2,730 | $20,760 |
Source: Public Records
Map
Nearby Homes
Your Personal Tour Guide
Ask me questions while you tour the home.