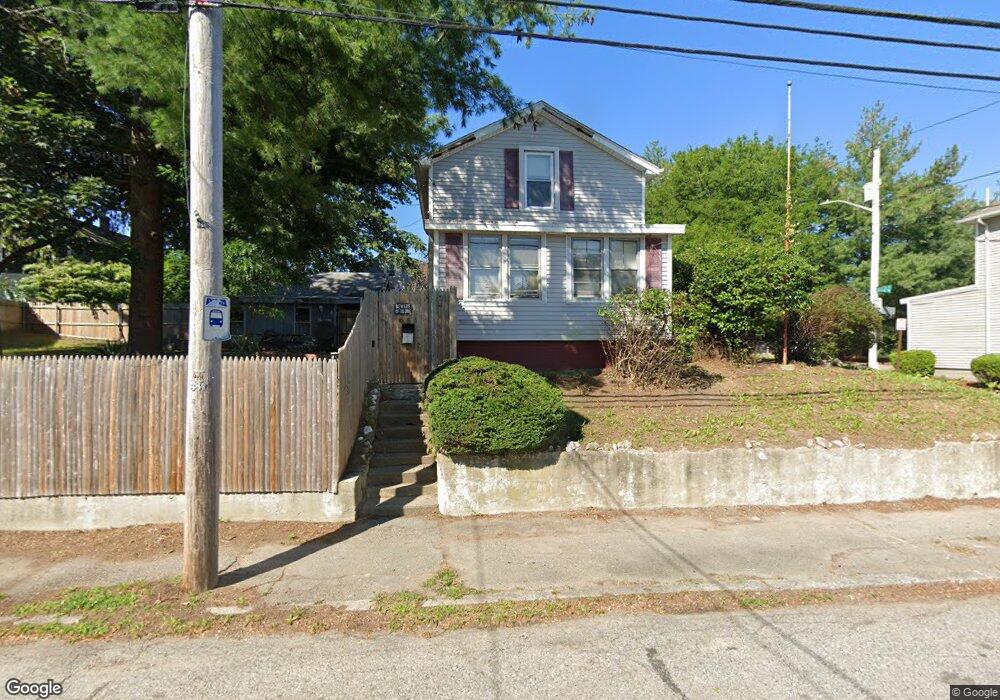
651 Bullocks Pt Ave East Providence, RI 02915
Riverside NeighborhoodEstimated Value: $375,000 - $414,000
2
Beds
1
Bath
931
Sq Ft
$423/Sq Ft
Est. Value
About This Home
This home is located at 651 Bullocks Pt Ave, East Providence, RI 02915 and is currently estimated at $393,483, approximately $422 per square foot. 651 Bullocks Pt Ave is a home located in Providence County with nearby schools including East Providence High School, St Luke Elementary School, and St Mary Academy-Bay View.
Ownership History
Date
Name
Owned For
Owner Type
Purchase Details
Closed on
Sep 27, 2019
Sold by
Mh Realty Llc
Bought by
Annicelli Taylor
Current Estimated Value
Home Financials for this Owner
Home Financials are based on the most recent Mortgage that was taken out on this home.
Original Mortgage
$207,178
Outstanding Balance
$184,231
Interest Rate
4.37%
Mortgage Type
FHA
Estimated Equity
$209,252
Purchase Details
Closed on
Aug 10, 2018
Sold by
Allan Keith
Bought by
Mh Realty Llc
Home Financials for this Owner
Home Financials are based on the most recent Mortgage that was taken out on this home.
Original Mortgage
$80,000
Interest Rate
4.5%
Mortgage Type
Commercial
Purchase Details
Closed on
Nov 29, 2012
Sold by
Miranda Virginia M
Bought by
Allan Keith
Create a Home Valuation Report for This Property
The Home Valuation Report is an in-depth analysis detailing your home's value as well as a comparison with similar homes in the area
Home Values in the Area
Average Home Value in this Area
Purchase History
| Date | Buyer | Sale Price | Title Company |
|---|---|---|---|
| Annicelli Taylor | $211,000 | -- | |
| Mh Realty Llc | $76,000 | -- | |
| Allan Keith | $80,000 | -- |
Source: Public Records
Mortgage History
| Date | Status | Borrower | Loan Amount |
|---|---|---|---|
| Open | Annicelli Taylor | $207,178 | |
| Previous Owner | Mh Realty Llc | $80,000 |
Source: Public Records
Tax History Compared to Growth
Tax History
| Year | Tax Paid | Tax Assessment Tax Assessment Total Assessment is a certain percentage of the fair market value that is determined by local assessors to be the total taxable value of land and additions on the property. | Land | Improvement |
|---|---|---|---|---|
| 2025 | $3,909 | $299,100 | $98,600 | $200,500 |
| 2024 | $3,606 | $235,200 | $82,200 | $153,000 |
| 2023 | $3,472 | $235,200 | $82,200 | $153,000 |
| 2022 | $3,351 | $153,300 | $56,300 | $97,000 |
| 2021 | $3,296 | $153,300 | $53,700 | $99,600 |
| 2020 | $3,156 | $153,300 | $53,700 | $99,600 |
| 2019 | $3,069 | $153,300 | $53,700 | $99,600 |
| 2018 | $2,714 | $118,600 | $54,000 | $64,600 |
| 2017 | $2,653 | $118,600 | $54,000 | $64,600 |
| 2016 | $2,640 | $118,600 | $54,000 | $64,600 |
| 2015 | $2,804 | $122,200 | $55,000 | $67,200 |
| 2014 | $2,804 | $122,200 | $55,000 | $67,200 |
Source: Public Records
Map
Nearby Homes
- 651 Bullocks Point Ave
- 14 Harding Ave
- 16 Harding Ave
- 649 Bullocks Point Ave
- 655 Bullocks Point Ave
- 0 Harding Ave
- 18 Harding Ave
- 85 White Ave
- 645 Bullocks Point Ave
- 13 Harding Ave
- 745 Bullocks Point Ave
- 81 White Ave
- 643 Bullocks Point Ave
- 745 Bullocks Pt Ave
- 22 Harding Ave
- 596A Bullocks Point Ave
- 641 Bullocks Point Ave
- 24 Harding Ave
- 9 Harding Ave
- 596 Bullocks Point Ave