Estimated Value: $71,000 - $80,307
2
Beds
1
Bath
1,036
Sq Ft
$72/Sq Ft
Est. Value
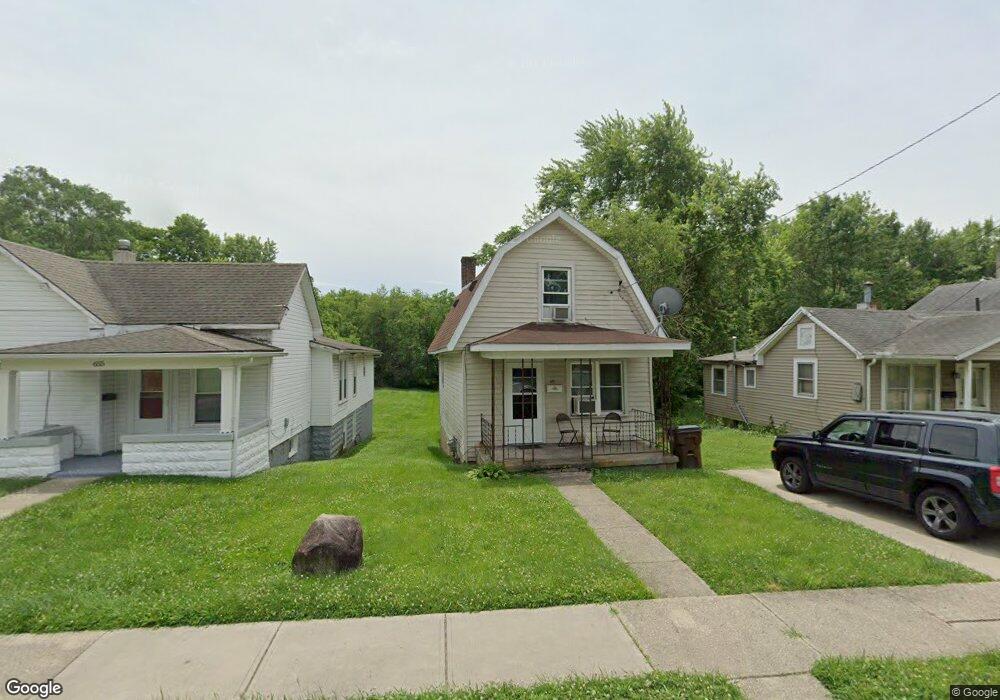
About This Home
This home is located at 651 E 3rd St, Xenia, OH 45385 and is currently estimated at $74,577, approximately $71 per square foot. 651 E 3rd St is a home located in Greene County with nearby schools including Xenia High School, Summit Academy Community School for Alternative Learners - Xenia, and Legacy Christian Academy.
Ownership History
Date
Name
Owned For
Owner Type
Purchase Details
Closed on
Jul 22, 2014
Sold by
Crawford James and Crawford Rosalynn M
Bought by
Crawford James and Crawford Rosalynn M
Current Estimated Value
Purchase Details
Closed on
Nov 30, 2005
Sold by
Hartley Robert F and Hartley Sharon
Bought by
Crawford James
Home Financials for this Owner
Home Financials are based on the most recent Mortgage that was taken out on this home.
Original Mortgage
$34,200
Outstanding Balance
$19,033
Interest Rate
6.2%
Mortgage Type
Fannie Mae Freddie Mac
Estimated Equity
$55,544
Create a Home Valuation Report for This Property
The Home Valuation Report is an in-depth analysis detailing your home's value as well as a comparison with similar homes in the area
Home Values in the Area
Average Home Value in this Area
Purchase History
| Date | Buyer | Sale Price | Title Company |
|---|---|---|---|
| Crawford James | -- | None Available | |
| Crawford James | $38,000 | -- |
Source: Public Records
Mortgage History
| Date | Status | Borrower | Loan Amount |
|---|---|---|---|
| Open | Crawford James | $34,200 |
Source: Public Records
Tax History
| Year | Tax Paid | Tax Assessment Tax Assessment Total Assessment is a certain percentage of the fair market value that is determined by local assessors to be the total taxable value of land and additions on the property. | Land | Improvement |
|---|---|---|---|---|
| 2024 | $665 | $15,280 | $3,050 | $12,230 |
| 2023 | $654 | $15,280 | $3,050 | $12,230 |
| 2022 | $563 | $11,220 | $2,770 | $8,450 |
| 2021 | $570 | $11,220 | $2,770 | $8,450 |
| 2020 | $547 | $11,220 | $2,770 | $8,450 |
| 2019 | $466 | $9,000 | $1,850 | $7,150 |
| 2018 | $468 | $9,000 | $1,850 | $7,150 |
| 2017 | $457 | $9,000 | $1,850 | $7,150 |
| 2016 | $457 | $8,640 | $1,850 | $6,790 |
| 2015 | $459 | $8,640 | $1,850 | $6,790 |
| 2014 | $439 | $8,640 | $1,850 | $6,790 |
Source: Public Records
Map
Nearby Homes
Your Personal Tour Guide
Ask me questions while you tour the home.