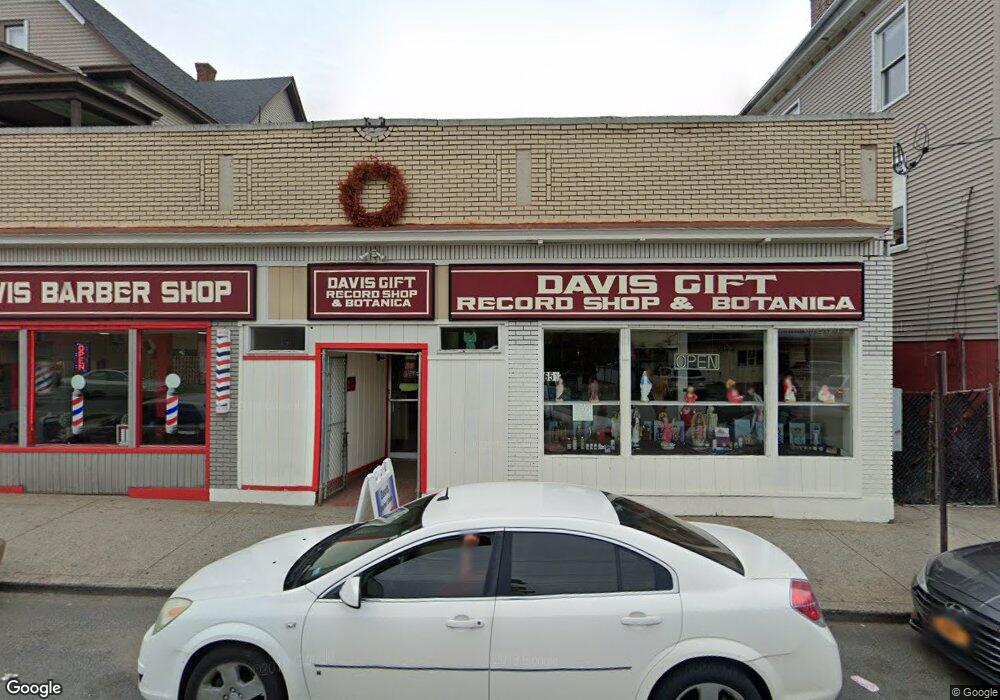
651 E Main St Waterbury, CT 06702
North End District NeighborhoodEstimated Value: $734,979
Studio
--
Bath
2,585
Sq Ft
$284/Sq Ft
Est. Value
About This Home
This home is located at 651 E Main St, Waterbury, CT 06702 and is currently estimated at $734,979, approximately $284 per square foot. 651 E Main St is a home located in New Haven County with nearby schools including Walsh School, Michael F. Wallace Middle School, and Crosby High School.
Ownership History
Date
Name
Owned For
Owner Type
Purchase Details
Closed on
Oct 31, 2019
Sold by
Global Inv Llc
Bought by
Wtby 5 Development Llc
Current Estimated Value
Purchase Details
Closed on
Oct 12, 2012
Sold by
M3 East Llc
Bought by
Global Inv Llc
Home Financials for this Owner
Home Financials are based on the most recent Mortgage that was taken out on this home.
Original Mortgage
$671,734
Interest Rate
5%
Mortgage Type
Commercial
Purchase Details
Closed on
Dec 23, 2011
Sold by
Private Mortgage Fund
Bought by
M3 East Llc
Purchase Details
Closed on
Dec 16, 2008
Sold by
Pmf Sandisfield Llc
Bought by
Allegrini Thomas P
Purchase Details
Closed on
Oct 29, 2007
Sold by
N England Re & Dev
Bought by
Pmf Sandisfield Llc
Purchase Details
Closed on
Jan 22, 2004
Sold by
G & J Dev
Bought by
New England Re And Dev
Purchase Details
Closed on
Dec 14, 1999
Sold by
Carter George H and Carter Margaret B
Bought by
Antonios Patrick
Create a Home Valuation Report for This Property
The Home Valuation Report is an in-depth analysis detailing your home's value as well as a comparison with similar homes in the area
Home Values in the Area
Average Home Value in this Area
Purchase History
| Date | Buyer | Sale Price | Title Company |
|---|---|---|---|
| Wtby 5 Development Llc | -- | -- | |
| Global Inv Llc | $309,005 | -- | |
| M3 East Llc | -- | -- | |
| Private Mortgage Fund | -- | -- | |
| Allegrini Thomas P | $425,000 | -- | |
| Pmf Sandisfield Llc | $375,463 | -- | |
| New England Re And Dev | $97,500 | -- | |
| Antonios Patrick | $67,500 | -- |
Source: Public Records
Mortgage History
| Date | Status | Borrower | Loan Amount |
|---|---|---|---|
| Previous Owner | Antonios Patrick | $671,734 | |
| Previous Owner | Antonios Patrick | $314,263 |
Source: Public Records
Tax History
| Year | Tax Paid | Tax Assessment Tax Assessment Total Assessment is a certain percentage of the fair market value that is determined by local assessors to be the total taxable value of land and additions on the property. | Land | Improvement |
|---|---|---|---|---|
| 2025 | $4,543 | $101,010 | $18,970 | $82,040 |
| 2024 | $4,994 | $101,010 | $18,970 | $82,040 |
| 2023 | $5,474 | $101,010 | $18,970 | $82,040 |
| 2022 | $4,013 | $66,650 | $18,970 | $47,680 |
| 2021 | $4,013 | $66,650 | $18,970 | $47,680 |
| 2020 | $4,013 | $66,650 | $18,970 | $47,680 |
| 2019 | $4,013 | $66,650 | $18,970 | $47,680 |
| 2018 | $4,013 | $66,650 | $18,970 | $47,680 |
| 2017 | $4,167 | $69,210 | $18,960 | $50,250 |
| 2016 | $4,167 | $69,210 | $18,960 | $50,250 |
| 2015 | $4,029 | $69,210 | $18,960 | $50,250 |
| 2014 | $4,029 | $69,210 | $18,960 | $50,250 |
Source: Public Records
Map
Nearby Homes