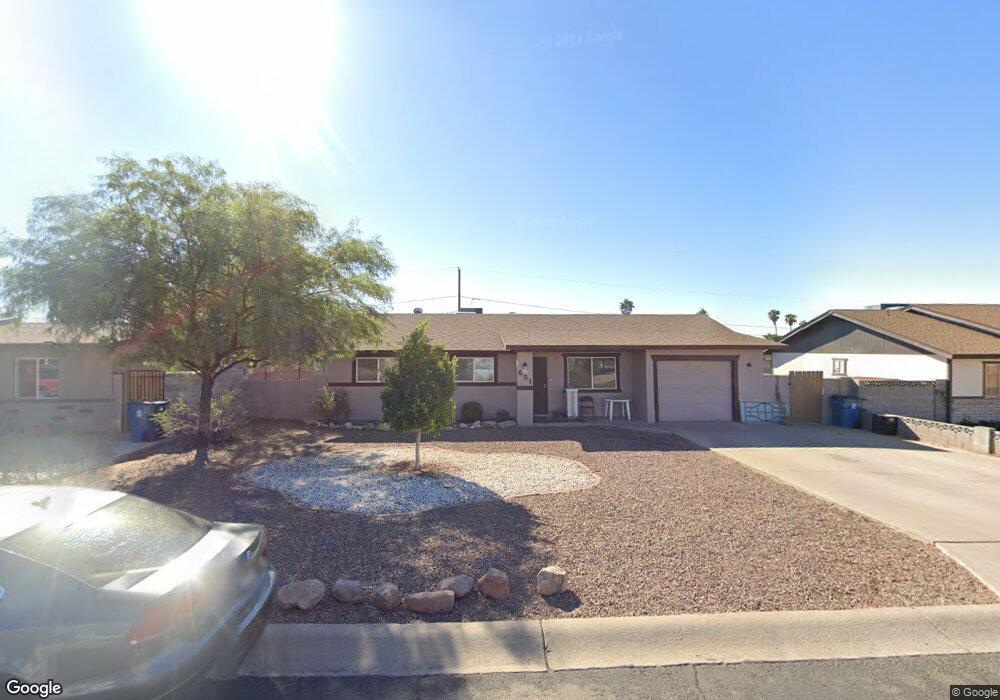
651 E Montebello Ave Apache Junction, AZ 85119
Estimated Value: $255,894 - $339,000
Studio
--
Bath
1,246
Sq Ft
$239/Sq Ft
Est. Value
About This Home
This home is located at 651 E Montebello Ave, Apache Junction, AZ 85119 and is currently estimated at $297,724, approximately $238 per square foot. 651 E Montebello Ave is a home located in Pinal County with nearby schools including Peralta Trail Elementary School, Cactus Canyon Junior High School, and Apache Junction High School.
Ownership History
Date
Name
Owned For
Owner Type
Purchase Details
Closed on
Sep 28, 2021
Sold by
Bitten Mary J and Mary Bitten Revocable Living T
Bought by
Bitten Mary J and Mary J Bitten Revocable Trust
Current Estimated Value
Purchase Details
Closed on
Sep 21, 2016
Sold by
Bitten Mary J
Bought by
Bitten Mary J
Purchase Details
Closed on
Feb 6, 2002
Sold by
Bitten Mary J
Bought by
Bitten Mary J
Purchase Details
Closed on
Sep 17, 1999
Sold by
Johnson Kelly B and Johnson Donna E
Bought by
Bitten Mary J
Purchase Details
Closed on
Apr 14, 1995
Sold by
Quinonez Richard J and Quinonez Caren G
Bought by
Johnson Kelly B and Huffman Donna E
Home Financials for this Owner
Home Financials are based on the most recent Mortgage that was taken out on this home.
Original Mortgage
$68,609
Interest Rate
7.88%
Mortgage Type
FHA
Create a Home Valuation Report for This Property
The Home Valuation Report is an in-depth analysis detailing your home's value as well as a comparison with similar homes in the area
Home Values in the Area
Average Home Value in this Area
Purchase History
| Date | Buyer | Sale Price | Title Company |
|---|---|---|---|
| Bitten Mary J | -- | None Available | |
| Bitten Mary J | -- | None Available | |
| Bitten Mary J | -- | -- | |
| Bitten Mary J | $83,900 | Old Republic Title Agency | |
| Johnson Kelly B | $69,000 | First American Title |
Source: Public Records
Mortgage History
| Date | Status | Borrower | Loan Amount |
|---|---|---|---|
| Previous Owner | Johnson Kelly B | $68,609 |
Source: Public Records
Tax History
| Year | Tax Paid | Tax Assessment Tax Assessment Total Assessment is a certain percentage of the fair market value that is determined by local assessors to be the total taxable value of land and additions on the property. | Land | Improvement |
|---|---|---|---|---|
| 2025 | $984 | $18,419 | -- | -- |
| 2024 | $969 | $26,076 | -- | -- |
| 2023 | $969 | $19,247 | $3,977 | $15,270 |
| 2022 | $929 | $13,641 | $3,977 | $9,664 |
| 2021 | $946 | $12,478 | $0 | $0 |
| 2020 | $922 | $10,083 | $0 | $0 |
| 2019 | $884 | $9,529 | $0 | $0 |
| 2018 | $866 | $7,397 | $0 | $0 |
| 2017 | $843 | $6,503 | $0 | $0 |
| 2016 | $822 | $6,415 | $1,100 | $5,315 |
| 2014 | $779 | $4,556 | $1,100 | $3,456 |
Source: Public Records
Map
Nearby Homes
- 755 E Mesquite Ave
- 1050 E Osage Ave
- 834 E Granada Ave
- 1325 E 19th Ave
- 1370 E 21st Ave
- 538 E Fred Ave
- 1373 E 23rd Ave
- 610 E Estevan Ave
- 1423 E 19th Ave
- 1038 E Friar Ave
- 1517 E 22nd Ave
- 1880 S Coconino Dr
- 1543 E 22nd Ave Unit 124
- 30 E 14th Ave
- 1980 S Apache Dr
- 2560 S Yavapai Rd
- 1358 W Kowa Cir Unit 358
- 451 E 10th Ave
- 1363 W Chesapeake Dr
- 1453 E Old West Hwy
- 671 E Montebello Ave Unit 14
- 623 E Montebello Ave
- 648 E Navajo Ave
- 699 E Montebello Ave
- 607 E Montebello Ave
- 664 E Navajo Ave
- 602 E Navajo Ave
- 630 E Montebello Ave
- 616 E Montebello Ave Unit 14
- 650 E Montebello Ave
- 698 E Navajo Ave
- 600 E Navajo Ave
- 556 E Montebello Ave
- 652 E Montebello Ave Unit 14
- 711 E Montebello Ave
- 579 E Montebello Ave
- 710 E Navajo Ave
- 586 E Navajo Ave
- 550 E Montebello Ave
- 688 E Montebello Ave
Your Personal Tour Guide
Ask me questions while you tour the home.