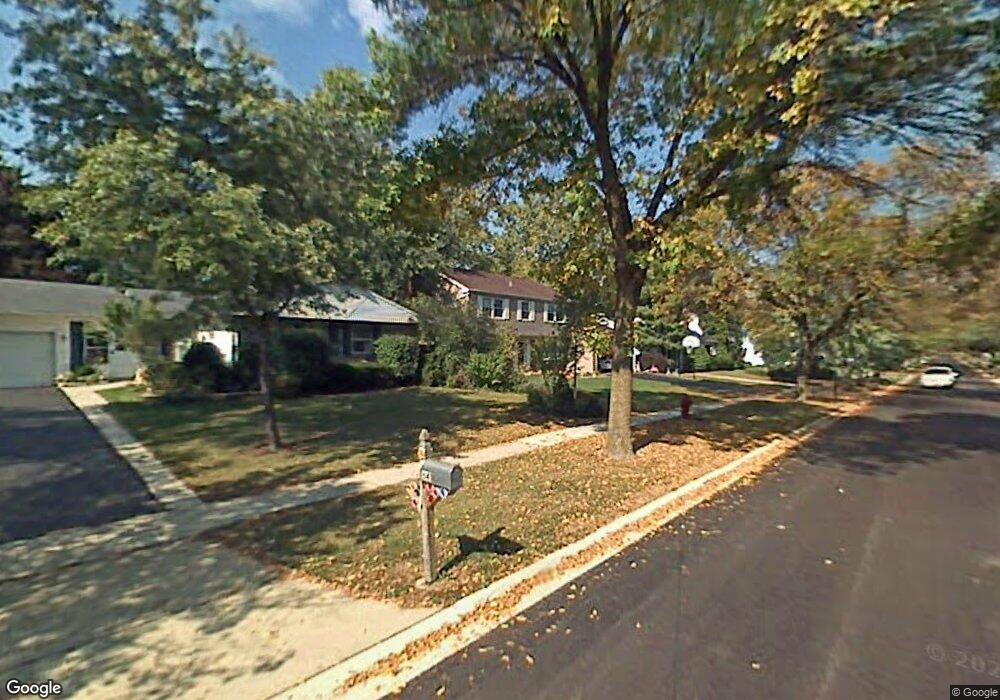
651 Indian Spring Ln Buffalo Grove, IL 60089
Estimated Value: $531,902 - $567,000
--
Bed
3
Baths
2,334
Sq Ft
$236/Sq Ft
Est. Value
About This Home
This home is located at 651 Indian Spring Ln, Buffalo Grove, IL 60089 and is currently estimated at $550,226, approximately $235 per square foot. 651 Indian Spring Ln is a home located in Lake County with nearby schools including Ivy Hall Elementary School, Twin Groves Middle School, and Adlai E Stevenson High School.
Ownership History
Date
Name
Owned For
Owner Type
Purchase Details
Closed on
Sep 28, 2021
Sold by
Micek Robert A and Micek Traci B
Bought by
Micek Traci Ann and Micek Robert Adrian
Current Estimated Value
Purchase Details
Closed on
Aug 8, 1996
Sold by
Simon Sheldon and Simon Jeanne C
Bought by
Micek Robert A and Micek Traci B
Home Financials for this Owner
Home Financials are based on the most recent Mortgage that was taken out on this home.
Original Mortgage
$202,500
Interest Rate
8.27%
Mortgage Type
Balloon
Purchase Details
Closed on
Mar 25, 1996
Sold by
Peilet David J and Peilet Lisa S
Bought by
Simon Sheldon and Simon Jeanne C
Home Financials for this Owner
Home Financials are based on the most recent Mortgage that was taken out on this home.
Original Mortgage
$207,000
Interest Rate
6.75%
Create a Home Valuation Report for This Property
The Home Valuation Report is an in-depth analysis detailing your home's value as well as a comparison with similar homes in the area
Home Values in the Area
Average Home Value in this Area
Purchase History
| Date | Buyer | Sale Price | Title Company |
|---|---|---|---|
| Micek Traci Ann | -- | Attorney | |
| Micek Robert A | $225,000 | -- | |
| Simon Sheldon | $222,000 | Chicago Title Insurance Co |
Source: Public Records
Mortgage History
| Date | Status | Borrower | Loan Amount |
|---|---|---|---|
| Closed | Micek Robert A | $202,500 | |
| Previous Owner | Simon Sheldon | $207,000 |
Source: Public Records
Tax History Compared to Growth
Tax History
| Year | Tax Paid | Tax Assessment Tax Assessment Total Assessment is a certain percentage of the fair market value that is determined by local assessors to be the total taxable value of land and additions on the property. | Land | Improvement |
|---|---|---|---|---|
| 2024 | $14,182 | $155,000 | $33,966 | $121,034 |
| 2023 | $14,123 | $146,254 | $32,049 | $114,205 |
| 2022 | $14,123 | $141,442 | $30,994 | $110,448 |
| 2021 | $13,588 | $139,917 | $30,660 | $109,257 |
| 2020 | $13,268 | $140,395 | $30,765 | $109,630 |
| 2019 | $13,085 | $139,878 | $30,652 | $109,226 |
| 2018 | $11,673 | $129,236 | $30,293 | $98,943 |
| 2017 | $11,452 | $126,219 | $29,586 | $96,633 |
| 2016 | $11,153 | $120,865 | $28,331 | $92,534 |
| 2015 | $10,857 | $113,032 | $26,495 | $86,537 |
| 2014 | $9,921 | $102,393 | $28,456 | $73,937 |
| 2012 | $9,840 | $102,598 | $28,513 | $74,085 |
Source: Public Records
Map
Nearby Homes
- 800 Clohesey Dr
- 610 Checker Dr
- 390 Springside Ln
- 12 Cloverdale Ct
- 931 Shady Grove Ln
- 950 Belmar Ln
- 711 Woodhollow Ln
- 887 Saybrook Ln Unit 2
- 1141 Devonshire Rd
- 1112 Auburn Ln
- 746 Old Checker Rd Unit E5
- 221 Thornapple Ct
- 1325 Fairfax Ln
- 1324 Fairfax Ln Unit B32
- 1032 Courtland Dr Unit 9
- 412 Chateau Dr
- 1514 Sumter Dr
- 1265 Devonshire Rd
- 1545 Chickamauga Ln
- 5107 N Arlington Heights Rd
- 641 Indian Spring Ln
- 661 Indian Spring Ln
- 712 Clohesey Dr
- 700 Clohesey Dr
- 724 Clohesey Dr
- 631 Indian Spring Ln
- 671 Indian Spring Ln
- 650 Indian Spring Ln
- 640 Indian Spring Ln
- 690 Clohesey Dr
- 736 Clohesey Dr
- 660 Indian Spring Ln
- 630 Indian Spring Ln
- 621 Indian Spring Ln
- 681 Indian Spring Ln
- 670 Indian Spring Ln
- 748 Clohesey Dr Unit 13
- 620 Indian Spring Ln
- 680 Clohesey Dr
- 651 Essington Ln