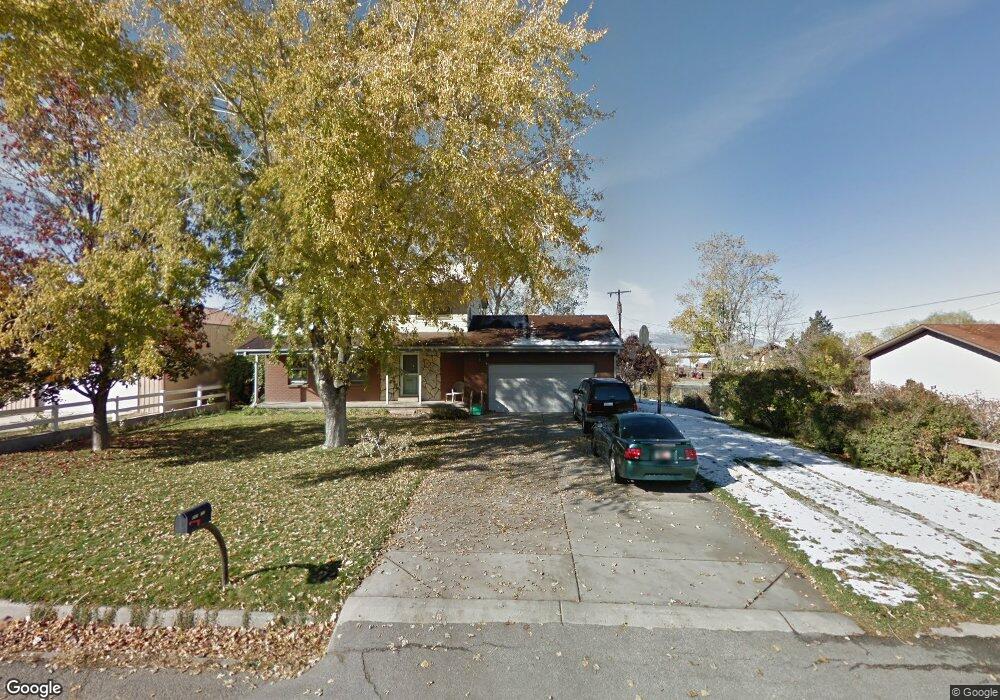
651 N 100 W Tooele, UT 84074
Estimated Value: $465,000 - $504,300
5
Beds
4
Baths
2,673
Sq Ft
$183/Sq Ft
Est. Value
About This Home
This home is located at 651 N 100 W, Tooele, UT 84074 and is currently estimated at $488,075, approximately $182 per square foot. 651 N 100 W is a home located in Tooele County with nearby schools including Northlake Elementary School, Tooele Junior High School, and Tooele High School.
Ownership History
Date
Name
Owned For
Owner Type
Purchase Details
Closed on
Nov 24, 2015
Sold by
Gray Jeffery Nw and Gray Aleesha B
Bought by
Gray Jeffery and Gray Aleesha
Current Estimated Value
Home Financials for this Owner
Home Financials are based on the most recent Mortgage that was taken out on this home.
Original Mortgage
$202,000
Outstanding Balance
$158,721
Interest Rate
3.76%
Mortgage Type
New Conventional
Estimated Equity
$329,354
Purchase Details
Closed on
Sep 6, 2006
Sold by
Tonioli Matthew B and Manzione Maria T
Bought by
Gray Jeffery N W and Gray Aleesha B
Home Financials for this Owner
Home Financials are based on the most recent Mortgage that was taken out on this home.
Original Mortgage
$41,200
Interest Rate
6.51%
Mortgage Type
Stand Alone Second
Create a Home Valuation Report for This Property
The Home Valuation Report is an in-depth analysis detailing your home's value as well as a comparison with similar homes in the area
Home Values in the Area
Average Home Value in this Area
Purchase History
| Date | Buyer | Sale Price | Title Company |
|---|---|---|---|
| Gray Jeffery | -- | Artisan Title Inc | |
| Gray Jeffery N W | -- | Equity Title |
Source: Public Records
Mortgage History
| Date | Status | Borrower | Loan Amount |
|---|---|---|---|
| Open | Gray Jeffery | $202,000 | |
| Previous Owner | Gray Jeffery N W | $41,200 | |
| Previous Owner | Gray Jeffery N W | $164,800 |
Source: Public Records
Tax History Compared to Growth
Tax History
| Year | Tax Paid | Tax Assessment Tax Assessment Total Assessment is a certain percentage of the fair market value that is determined by local assessors to be the total taxable value of land and additions on the property. | Land | Improvement |
|---|---|---|---|---|
| 2025 | $3,340 | $278,603 | $88,028 | $190,575 |
| 2024 | $3,297 | $251,659 | $88,028 | $163,631 |
| 2023 | $3,297 | $245,214 | $84,113 | $161,101 |
| 2022 | $2,780 | $239,146 | $72,270 | $166,876 |
| 2021 | $2,387 | $171,791 | $48,180 | $123,611 |
| 2020 | $2,342 | $292,311 | $67,563 | $224,748 |
| 2019 | $2,184 | $268,231 | $67,563 | $200,668 |
| 2018 | $1,995 | $232,223 | $65,000 | $167,223 |
| 2017 | $1,494 | $206,472 | $40,438 | $166,034 |
| 2016 | $1,242 | $101,648 | $22,241 | $79,407 |
| 2015 | $1,242 | $90,356 | $0 | $0 |
| 2014 | -- | $90,356 | $0 | $0 |
Source: Public Records
Map
Nearby Homes
- 530 N 50 W
- 107 W 600 N Unit 204
- 244 W 670 N
- 524 N 200 W
- 277 W 670 N
- 79 E 600 N
- 834 N 200 W
- 705 N 200 E
- 353 W 630 N Unit 19
- 118 E 730 N Unit 104
- 363 W 630 North St Unit 20
- 122 E 730 N Unit 105
- 374 W 630 North St Unit 10
- 352 W 600 N Unit 44
- 377 W 630 St N Unit 22
- 394 W 630 N Unit 8
- 362 W 600 N Unit 43
- 312 W Sapphire Dr
- 683 Hidden River Trail W
- Snowbird Plan at Vista Meadows