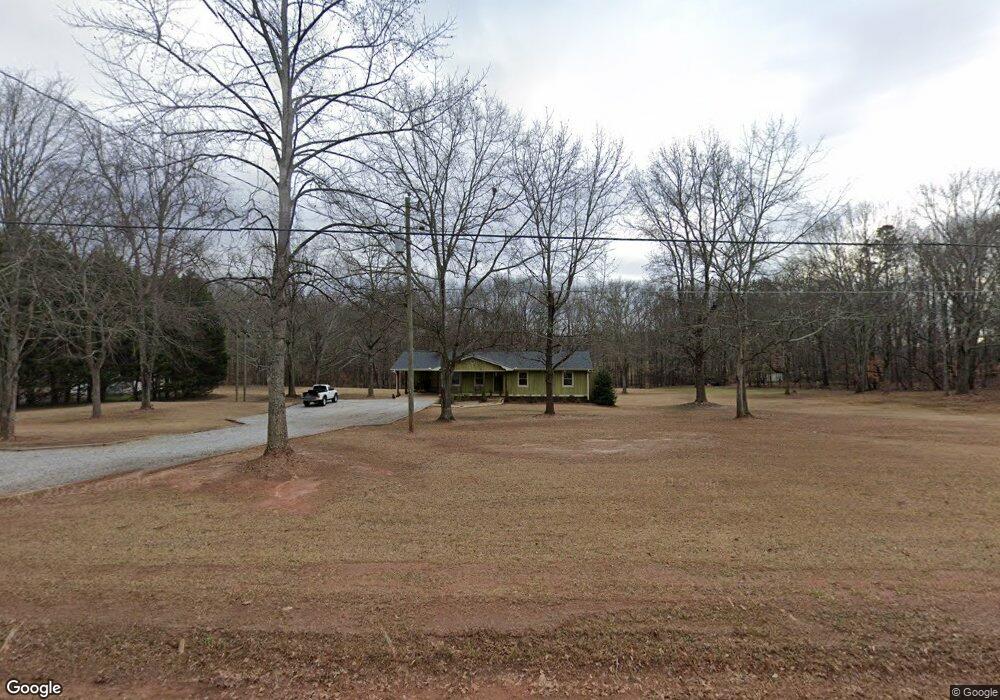
651 Old Kings Bridge Rd Nicholson, GA 30565
Estimated Value: $125,000 - $256,000
--
Bed
--
Bath
1,211
Sq Ft
$155/Sq Ft
Est. Value
About This Home
This home is located at 651 Old Kings Bridge Rd, Nicholson, GA 30565 and is currently estimated at $187,447, approximately $154 per square foot. 651 Old Kings Bridge Rd is a home with nearby schools including East Jackson Middle School and East Jackson Comprehensive High School.
Ownership History
Date
Name
Owned For
Owner Type
Purchase Details
Closed on
Oct 28, 2015
Sold by
Freeman Jimmy K
Bought by
Hardy William K
Current Estimated Value
Home Financials for this Owner
Home Financials are based on the most recent Mortgage that was taken out on this home.
Original Mortgage
$131,461
Outstanding Balance
$103,681
Interest Rate
3.87%
Mortgage Type
FHA
Estimated Equity
$83,766
Purchase Details
Closed on
Oct 29, 2014
Sold by
Hart Cheryl
Bought by
Hardy William K and Freeman Jimmy K
Home Financials for this Owner
Home Financials are based on the most recent Mortgage that was taken out on this home.
Original Mortgage
$112,429
Interest Rate
4.26%
Mortgage Type
New Conventional
Purchase Details
Closed on
Aug 14, 2006
Sold by
Not Provided
Bought by
Hart Cheryl D and Hart Gerald O
Purchase Details
Closed on
Jul 26, 2002
Sold by
Hart Michael and Marla Anita
Bought by
Hart Cheryl Wilson
Purchase Details
Closed on
Mar 31, 1977
Sold by
Hart Gerald
Bought by
Hart Cheryl Wilson
Create a Home Valuation Report for This Property
The Home Valuation Report is an in-depth analysis detailing your home's value as well as a comparison with similar homes in the area
Home Values in the Area
Average Home Value in this Area
Purchase History
| Date | Buyer | Sale Price | Title Company |
|---|---|---|---|
| Hardy William K | -- | -- | |
| Hardy William K | $40,000 | -- | |
| Hart Cheryl D | -- | -- | |
| Hart Cheryl Wilson | -- | -- | |
| Hart Cheryl Wilson | -- | -- |
Source: Public Records
Mortgage History
| Date | Status | Borrower | Loan Amount |
|---|---|---|---|
| Open | Hardy William K | $131,461 | |
| Previous Owner | Hardy William K | $112,429 |
Source: Public Records
Tax History Compared to Growth
Tax History
| Year | Tax Paid | Tax Assessment Tax Assessment Total Assessment is a certain percentage of the fair market value that is determined by local assessors to be the total taxable value of land and additions on the property. | Land | Improvement |
|---|---|---|---|---|
| 2024 | $1,299 | $50,804 | $48,760 | $2,044 |
| 2023 | $1,299 | $50,804 | $48,760 | $2,044 |
| 2022 | $541 | $18,604 | $16,560 | $2,044 |
| 2021 | $535 | $18,604 | $16,560 | $2,044 |
| 2020 | $587 | $18,604 | $16,560 | $2,044 |
| 2019 | $596 | $18,604 | $16,560 | $2,044 |
| 2018 | $609 | $18,760 | $16,560 | $2,200 |
| 2017 | $577 | $17,632 | $15,430 | $2,202 |
| 2016 | $581 | $17,632 | $15,430 | $2,202 |
| 2015 | $529 | $17,631 | $15,430 | $2,202 |
| 2014 | $578 | $17,631 | $15,430 | $2,202 |
| 2013 | -- | $17,631 | $15,429 | $2,201 |
Source: Public Records
Map
Nearby Homes
- 104 Staplers Bridge Rd
- 1192 Old Kings Bridge Rd
- 520 Old Athens Dr
- 719 Old Athens Dr
- 0 Jefferson Dr Unit 7635823
- 0 Jefferson Dr Unit 10588928
- 0 Birch St Unit 7627498
- 5111 U S 441
- 334 Summit Heights Dr
- 7 Red Rose Rd
- 9 Red Rose Rd
- 301 Summit Heights Dr
- 620 Ivy Creek Dr
- 192 Plantation Crossing
- 573 Sanford Dr
- 10 Red Rose Rd
- 0 Watkins Trail Unit TRACT 22
- 0 Sanford Oak Ct Unit 7683746
- 0 Sanford Oak Ct Unit TRACT 11
- 0 Sanford Oak Ct Unit TRACT 12
- 615 Old Kings Bridge Rd
- 718 Old Kings Bridge Rd
- 757 Old Kings Bridge Rd
- 0 Old Kings Bridge Rd Unit CM911046
- 0 Old Kings Bridge Rd Unit 8541054
- 0 Old Kings Bridge Rd Unit 8013024
- 0 Old Kings Bridge Rd Unit 7473636
- 0 Old Kings Bridge Rd Unit 8731534
- 0 Old Kings Bridge Rd Unit 9022656
- 0 Old Kings Bridge Rd Unit 8487952
- 0 Old Kings Bridge Rd Unit 8709025
- 0 Old Kings Bridge Rd Unit 3078088
- 0 Old Kings Bridge Rd Unit 3091177
- 0 Old Kings Bridge Rd Unit 3207867
- 0 Old Kings Bridge Rd Unit 7553004
- 0 Old Kings Bridge Rd Unit 8000958
- 0 Old Kings Bridge Rd Unit 8333871
- 0 Old Kings Bridge Rd Unit 8351380
- 0 Old Kings Bridge Rd Unit 967533