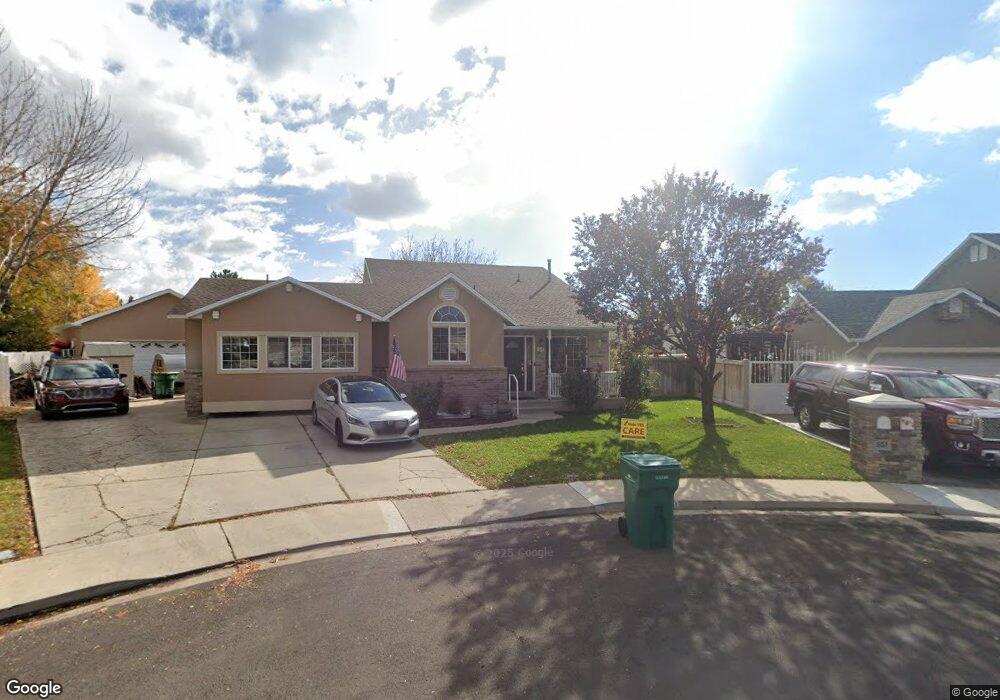
651 W 1400 N Orem, UT 84057
Bonneville NeighborhoodEstimated Value: $594,000 - $648,000
3
Beds
3
Baths
1,652
Sq Ft
$370/Sq Ft
Est. Value
About This Home
This home is located at 651 W 1400 N, Orem, UT 84057 and is currently estimated at $612,015, approximately $370 per square foot. 651 W 1400 N is a home located in Utah County with nearby schools including Bonneville Elementary School, Orem Junior High School, and Timpanogos High School.
Ownership History
Date
Name
Owned For
Owner Type
Purchase Details
Closed on
Apr 4, 2011
Sold by
Wheelhouse Sean Scott
Bought by
Wheelhouse Sean Scott
Current Estimated Value
Home Financials for this Owner
Home Financials are based on the most recent Mortgage that was taken out on this home.
Original Mortgage
$186,000
Outstanding Balance
$128,922
Interest Rate
4.9%
Mortgage Type
New Conventional
Estimated Equity
$483,093
Purchase Details
Closed on
Jun 7, 1996
Sold by
Wheelhouse Sean Scott and Wheelhouse Jolynne
Bought by
Wheelhouse Sean Scott
Home Financials for this Owner
Home Financials are based on the most recent Mortgage that was taken out on this home.
Original Mortgage
$109,500
Interest Rate
8.01%
Create a Home Valuation Report for This Property
The Home Valuation Report is an in-depth analysis detailing your home's value as well as a comparison with similar homes in the area
Home Values in the Area
Average Home Value in this Area
Purchase History
| Date | Buyer | Sale Price | Title Company |
|---|---|---|---|
| Wheelhouse Sean Scott | -- | Advanced Title | |
| Wheelhouse Sean Scott | -- | -- |
Source: Public Records
Mortgage History
| Date | Status | Borrower | Loan Amount |
|---|---|---|---|
| Open | Wheelhouse Sean Scott | $186,000 | |
| Closed | Wheelhouse Sean Scott | $109,500 |
Source: Public Records
Tax History
| Year | Tax Paid | Tax Assessment Tax Assessment Total Assessment is a certain percentage of the fair market value that is determined by local assessors to be the total taxable value of land and additions on the property. | Land | Improvement |
|---|---|---|---|---|
| 2025 | $2,293 | $304,480 | -- | -- |
| 2024 | $2,293 | $280,335 | $0 | $0 |
| 2023 | $2,146 | $281,985 | $0 | $0 |
| 2022 | $2,248 | $286,165 | $0 | $0 |
| 2021 | $2,095 | $404,000 | $159,800 | $244,200 |
| 2020 | $1,937 | $367,200 | $127,800 | $239,400 |
| 2019 | $1,715 | $338,000 | $127,800 | $210,200 |
| 2018 | $1,651 | $310,900 | $116,900 | $194,000 |
| 2017 | $1,562 | $157,520 | $0 | $0 |
| 2016 | $1,608 | $149,545 | $0 | $0 |
| 2015 | $1,481 | $130,295 | $0 | $0 |
| 2014 | $1,392 | $121,880 | $0 | $0 |
Source: Public Records
Map
Nearby Homes
- 582 W 1300 N
- 531 W 1350 N
- 512 W 1450 N
- 1405 N 770 W
- 1545 N State St Unit 1
- 1552 N 740 W
- 1244 N 580 W
- 1461 N Amiron Way Unit D
- 1461 N Amiron Way Unit B
- 332 W Amiron Way Unit D
- 538 W 1120 N
- 1123 N 800 W
- 1547 N 275 West St Unit 5
- 1566 N 275 West St Unit 1
- 967 W 1630 N
- 1663 N 980 W
- 686 W 1870 N Unit 12
- 999 W 1100 N
- 1086 N 1005 W
- 1167 W 1550 N
Your Personal Tour Guide
Ask me questions while you tour the home.