Estimated Value: $168,000 - $214,383
3
Beds
2
Baths
1,200
Sq Ft
$159/Sq Ft
Est. Value
About This Home
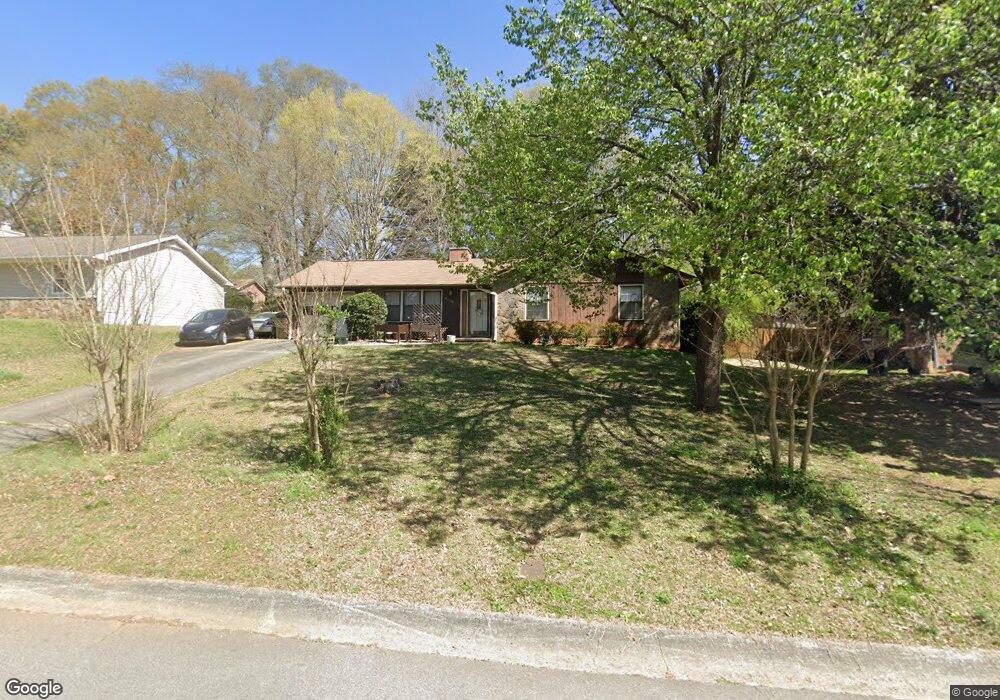
This home is located at 6510 Bobolink Ct, Rex, GA 30273 and is currently estimated at $191,192, approximately $159 per square foot. 6510 Bobolink Ct is a home located in Clayton County with nearby schools including William M. Mcgarrah Elementary School, Rex Mill Middle School, and Mount Zion High School.
Ownership History
Date
Name
Owned For
Owner Type
Purchase Details
Closed on
Oct 28, 2023
Sold by
Canaan Judith
Bought by
Canaan Judith
Current Estimated Value
Purchase Details
Closed on
Jul 6, 2010
Sold by
Chase Hm Fin Llc
Bought by
Hud-Housing Of Urban Dev
Purchase Details
Closed on
Dec 31, 2003
Sold by
Waugh Lance E
Bought by
Waugh Lynn L
Home Financials for this Owner
Home Financials are based on the most recent Mortgage that was taken out on this home.
Original Mortgage
$107,285
Interest Rate
6.03%
Mortgage Type
VA
Purchase Details
Closed on
Apr 28, 1999
Sold by
Waugh Lawrence E and Waugh Peggy L
Bought by
Waugh Lance E
Home Financials for this Owner
Home Financials are based on the most recent Mortgage that was taken out on this home.
Original Mortgage
$85,000
Interest Rate
6.87%
Mortgage Type
New Conventional
Create a Home Valuation Report for This Property
The Home Valuation Report is an in-depth analysis detailing your home's value as well as a comparison with similar homes in the area
Home Values in the Area
Average Home Value in this Area
Purchase History
| Date | Buyer | Sale Price | Title Company |
|---|---|---|---|
| Canaan Judith | $180,500 | -- | |
| Hud-Housing Of Urban Dev | -- | -- | |
| Chase Hm Fin Llc | $118,900 | -- | |
| Waugh Lynn L | $109,000 | -- | |
| Waugh Lance E | $85,000 | -- |
Source: Public Records
Mortgage History
| Date | Status | Borrower | Loan Amount |
|---|---|---|---|
| Previous Owner | Waugh Lynn L | $107,285 | |
| Previous Owner | Waugh Lance E | $85,000 |
Source: Public Records
Tax History Compared to Growth
Tax History
| Year | Tax Paid | Tax Assessment Tax Assessment Total Assessment is a certain percentage of the fair market value that is determined by local assessors to be the total taxable value of land and additions on the property. | Land | Improvement |
|---|---|---|---|---|
| 2024 | $1,189 | $71,240 | $7,200 | $64,040 |
| 2023 | $730 | $72,200 | $7,200 | $65,000 |
| 2022 | $866 | $55,000 | $7,200 | $47,800 |
| 2021 | $1,376 | $44,840 | $7,200 | $37,640 |
| 2020 | $1,076 | $36,896 | $7,200 | $29,696 |
| 2019 | $956 | $33,538 | $6,400 | $27,138 |
| 2018 | $742 | $28,276 | $6,400 | $21,876 |
| 2017 | $601 | $24,778 | $6,400 | $18,378 |
| 2016 | $624 | $25,324 | $6,400 | $18,924 |
| 2015 | $537 | $0 | $0 | $0 |
| 2014 | $555 | $23,944 | $6,400 | $17,544 |
Source: Public Records
Map
Nearby Homes
- 6502 Bobolink Ct
- 6518 Bobolink Ct
- 6513 Paula Ct Unit 2
- 6494 Bobolink Ct
- 6505 Paula Ct
- 3004 Menlo Park Dr Unit 3
- 2994 Menlo Park Dr
- 2984 Menlo Park Dr Unit 3
- 6511 Bobolink Ct
- 3014 Menlo Park Dr
- 6503 Bobolink Ct
- 6499 Paula Ct
- 6519 Bobolink Ct Unit 3
- 6486 Bobolink Ct
- 0 Paula Ct Unit 3284879
- 0 Paula Ct Unit 8019620
- 0 Paula Ct Unit 7238338
- 0 Paula Ct
- 6493 Bobolink Ct
- 6529 Bobolink Ct Unit 3