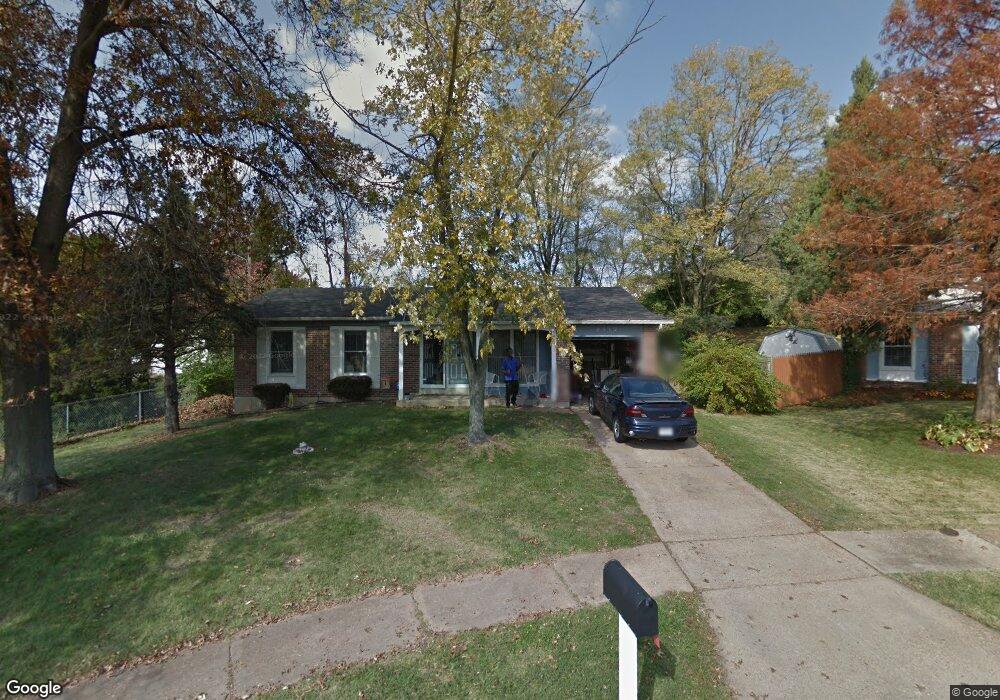
6512 El Campo Ct Florissant, MO 63033
Estimated Value: $141,000 - $180,000
3
Beds
2
Baths
1,094
Sq Ft
$152/Sq Ft
Est. Value
About This Home
This home is located at 6512 El Campo Ct, Florissant, MO 63033 and is currently estimated at $166,336, approximately $152 per square foot. 6512 El Campo Ct is a home located in St. Louis County with nearby schools including Grannemann Elementary School, Hazelwood East High School, and Salem Lutheran School.
Ownership History
Date
Name
Owned For
Owner Type
Purchase Details
Closed on
Aug 4, 2025
Sold by
Thompson Jason A
Bought by
Thompson Jason A and Thompson Akiba
Current Estimated Value
Home Financials for this Owner
Home Financials are based on the most recent Mortgage that was taken out on this home.
Original Mortgage
$123,626
Outstanding Balance
$123,197
Interest Rate
5.89%
Mortgage Type
FHA
Estimated Equity
$43,139
Purchase Details
Closed on
Jun 9, 2011
Sold by
Harris Evelyn
Bought by
Thompson Jason A
Home Financials for this Owner
Home Financials are based on the most recent Mortgage that was taken out on this home.
Original Mortgage
$51,217
Interest Rate
5.25%
Mortgage Type
FHA
Purchase Details
Closed on
Apr 21, 2005
Sold by
Broyles Betty
Bought by
Harris Evelyn
Home Financials for this Owner
Home Financials are based on the most recent Mortgage that was taken out on this home.
Original Mortgage
$99,920
Interest Rate
9.55%
Mortgage Type
Fannie Mae Freddie Mac
Create a Home Valuation Report for This Property
The Home Valuation Report is an in-depth analysis detailing your home's value as well as a comparison with similar homes in the area
Home Values in the Area
Average Home Value in this Area
Purchase History
| Date | Buyer | Sale Price | Title Company |
|---|---|---|---|
| Thompson Jason A | -- | None Listed On Document | |
| Thompson Jason A | $52,900 | Integrity Land Title Co Inc | |
| Harris Evelyn | $124,900 | Fa |
Source: Public Records
Mortgage History
| Date | Status | Borrower | Loan Amount |
|---|---|---|---|
| Open | Thompson Jason A | $123,626 | |
| Previous Owner | Thompson Jason A | $51,217 | |
| Previous Owner | Harris Evelyn | $99,920 | |
| Closed | Harris Evelyn | $24,980 |
Source: Public Records
Tax History Compared to Growth
Tax History
| Year | Tax Paid | Tax Assessment Tax Assessment Total Assessment is a certain percentage of the fair market value that is determined by local assessors to be the total taxable value of land and additions on the property. | Land | Improvement |
|---|---|---|---|---|
| 2025 | $2,179 | $28,810 | $3,820 | $24,990 |
| 2024 | $2,179 | $24,030 | $2,640 | $21,390 |
| 2023 | $2,171 | $24,030 | $2,640 | $21,390 |
| 2022 | $1,870 | $18,380 | $4,980 | $13,400 |
| 2021 | $1,770 | $18,380 | $4,980 | $13,400 |
| 2020 | $1,798 | $17,400 | $2,980 | $14,420 |
| 2019 | $1,784 | $17,400 | $2,980 | $14,420 |
| 2018 | $1,567 | $14,100 | $1,750 | $12,350 |
| 2017 | $1,565 | $14,100 | $1,750 | $12,350 |
| 2016 | $1,786 | $15,870 | $2,510 | $13,360 |
| 2015 | $1,746 | $15,870 | $2,510 | $13,360 |
| 2014 | $1,955 | $17,730 | $3,040 | $14,690 |
Source: Public Records
Map
Nearby Homes
- 6530 Farm Pond Ct
- 11922 La Padera Ln
- 11774 El Somo Ct
- 11760 Sheffield Dr
- 11757 Vizcuya Ct
- 11440 Sheffield Dr
- 12095 El Camara Dr
- 12136 La Padera Ln
- 6250 Pennyrich Ct
- 2291 Redman Rd
- 11377 Fox Hall Ln
- 11401 Northway Dr
- 11951 Jerries Ln
- 1911 Redman Rd
- 12320 Missile Ln
- 11905 Rosevalley Ln
- 1730 Parktree Ln
- 11292 Jerries Ln
- 12292 Jerries Ln
- 1912 Shardell Dr
- 11852 La Padera Ln
- 6522 El Campo Ct
- 6502 El Campo Ct
- 6520 Farm Pond Ct
- 6510 Farm Pond Ct
- 6531 El Campo Ct
- 11872 La Padera Ln
- 6501 El Campo Ct
- 6511 El Campo Ct
- 6521 El Campo Ct
- 11695 Sheffield Dr
- 11715 Sheffield Dr
- 11685 Sheffield Dr
- 11812 La Padera Ln
- 11851 La Padera Ln
- 11841 La Padera Ln
- 11725 Sheffield Dr
- 11881 La Padera Ln
- 11831 La Padera Ln
- 11675 Sheffield Dr