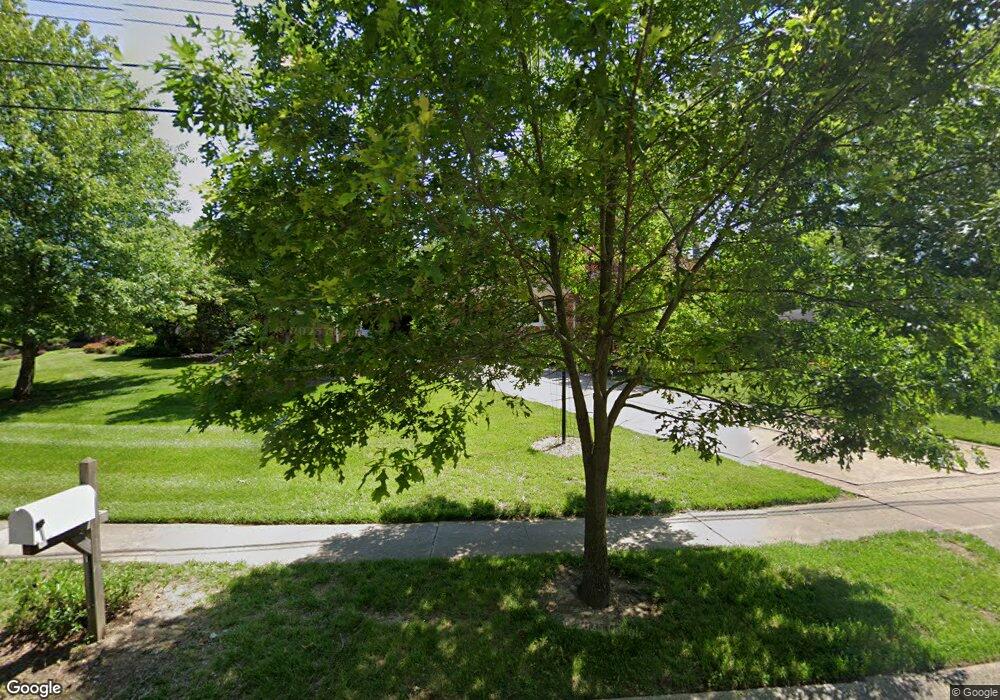
6513 Apache Cir Cincinnati, OH 45243
Estimated Value: $457,000 - $588,000
3
Beds
2
Baths
1,923
Sq Ft
$269/Sq Ft
Est. Value
About This Home
This home is located at 6513 Apache Cir, Cincinnati, OH 45243 and is currently estimated at $517,817, approximately $269 per square foot. 6513 Apache Cir is a home located in Hamilton County with nearby schools including Madeira Elementary School, Madeira Middle School, and Madeira High School.
Ownership History
Date
Name
Owned For
Owner Type
Purchase Details
Closed on
Jun 6, 2022
Sold by
Schweitzer Joseph V and Schweitzer Marcy L
Bought by
Lewis Schweitzer An Family Trust
Current Estimated Value
Purchase Details
Closed on
Apr 10, 2009
Sold by
Haverkos E Jean
Bought by
Schweitzer Joseph and Schweitzer Marcy L
Home Financials for this Owner
Home Financials are based on the most recent Mortgage that was taken out on this home.
Original Mortgage
$125,000
Interest Rate
5.05%
Mortgage Type
New Conventional
Purchase Details
Closed on
Jul 14, 1999
Sold by
Jean Haaverkos E
Bought by
Haverkos E Jean
Purchase Details
Closed on
Jul 19, 1996
Sold by
Haverkos Norman P
Bought by
Haverkos E Jean
Create a Home Valuation Report for This Property
The Home Valuation Report is an in-depth analysis detailing your home's value as well as a comparison with similar homes in the area
Home Values in the Area
Average Home Value in this Area
Purchase History
| Date | Buyer | Sale Price | Title Company |
|---|---|---|---|
| Lewis Schweitzer An Family Trust | -- | Favret Bruce A | |
| Lewis Schweitzer An Family Trust | -- | Favret Bruce A | |
| Schweitzer Joseph | $220,000 | Attorney | |
| Haverkos E Jean | -- | -- | |
| Haverkos E Jean | -- | -- |
Source: Public Records
Mortgage History
| Date | Status | Borrower | Loan Amount |
|---|---|---|---|
| Previous Owner | Schweitzer Joseph | $125,000 |
Source: Public Records
Tax History
| Year | Tax Paid | Tax Assessment Tax Assessment Total Assessment is a certain percentage of the fair market value that is determined by local assessors to be the total taxable value of land and additions on the property. | Land | Improvement |
|---|---|---|---|---|
| 2025 | $7,298 | $124,166 | $47,250 | $76,916 |
| 2024 | $7,108 | $124,166 | $47,250 | $76,916 |
| 2023 | $7,203 | $124,166 | $47,250 | $76,916 |
| 2022 | $6,347 | $89,432 | $36,050 | $53,382 |
| 2021 | $6,211 | $89,432 | $36,050 | $53,382 |
| 2020 | $5,746 | $89,432 | $36,050 | $53,382 |
| 2019 | $6,046 | $86,828 | $35,000 | $51,828 |
| 2018 | $6,095 | $86,828 | $35,000 | $51,828 |
| 2017 | $5,779 | $86,828 | $35,000 | $51,828 |
| 2016 | $5,597 | $74,690 | $16,296 | $58,394 |
| 2015 | $4,876 | $74,690 | $16,296 | $58,394 |
| 2014 | $4,904 | $74,690 | $16,296 | $58,394 |
| 2013 | $5,247 | $77,000 | $16,800 | $60,200 |
Source: Public Records
Map
Nearby Homes
- 6495 Dawson Rd
- 6752 Rose Crest Ave
- 7406 Dawson Rd
- 6095 Kenwood Rd
- 7469 Camargo Rd
- 6242 Fulsher Ln
- 7437 Madeira Pines Dr
- 7151 Euclid Ave
- 7474 Dawson Rd
- 6041 Johnson St
- 5995 Crabtree Ln
- 7159 Hosbrook Rd
- 7133 Fowler Ave
- 7220 Mar Del Dr
- 7752 Montgomery Rd
- 7317 Euclid Ave
- 7321 Hosbrook Rd
- 7335 Demar Rd
- 5801 Kenwood Rd
- 7156 Maple Ave
- 6529 Apache Cir
- 6503 Apache Cir
- 6694 Apache Cir
- 6533 Apache Cir
- 6516 Apache Cir
- 6690 Apache Cir
- 6500 Apache Cir
- 6538 Minnewauken Dr
- 6526 Apache Cir
- 6686 Apache Cir
- 6535 Apache Cir
- 6532 Apache Cir
- 6550 Minnewauken Dr
- 6499 Navaho Trail
- 6615 Dawson Rd
- 6680 Apache Cir
- 6537 Apache Cir
- 6536 Apache Cir
- 6568 Minnewauken Dr
- 6607 Dawson Rd
Your Personal Tour Guide
Ask me questions while you tour the home.