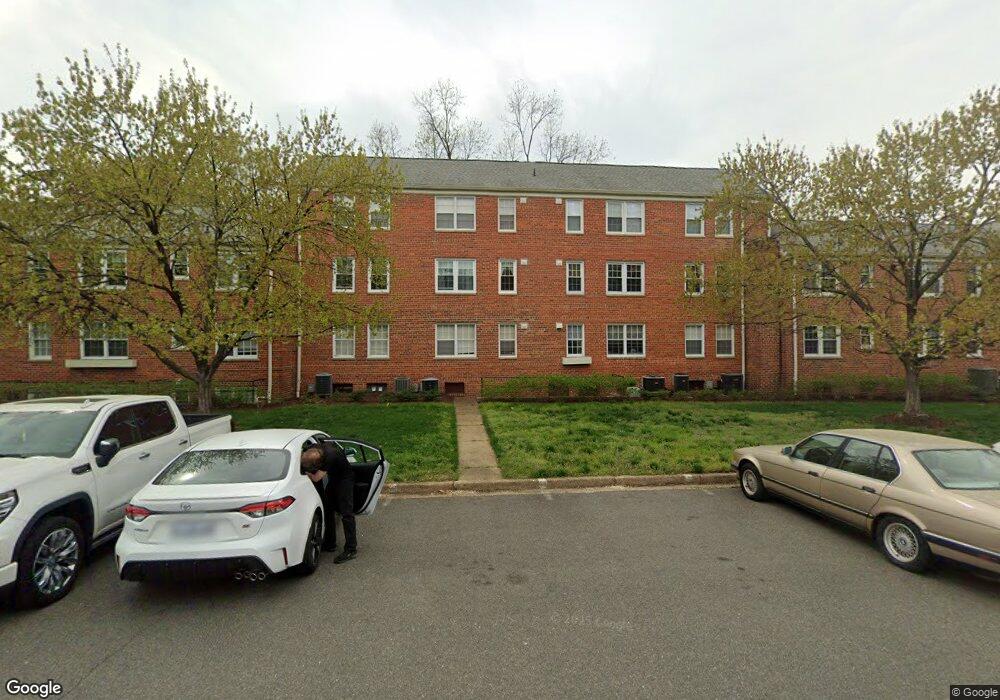
6515 Potomac Ave Unit A1 Alexandria, VA 22307
Belle Haven NeighborhoodEstimated Value: $310,000 - $344,000
2
Beds
1
Bath
793
Sq Ft
$413/Sq Ft
Est. Value
About This Home
This home is located at 6515 Potomac Ave Unit A1, Alexandria, VA 22307 and is currently estimated at $327,497, approximately $412 per square foot. 6515 Potomac Ave Unit A1 is a home located in Fairfax County with nearby schools including Belle View Elementary School, Sandburg Middle, and West Potomac High School.
Ownership History
Date
Name
Owned For
Owner Type
Purchase Details
Closed on
Apr 19, 2006
Sold by
Foote Megan E
Bought by
Fitzpatrick John O
Current Estimated Value
Home Financials for this Owner
Home Financials are based on the most recent Mortgage that was taken out on this home.
Original Mortgage
$219,200
Outstanding Balance
$126,039
Interest Rate
6.37%
Mortgage Type
New Conventional
Estimated Equity
$201,458
Purchase Details
Closed on
Jul 2, 2003
Sold by
Stearman Anthony
Bought by
Foote Megan
Home Financials for this Owner
Home Financials are based on the most recent Mortgage that was taken out on this home.
Original Mortgage
$168,000
Interest Rate
5.46%
Mortgage Type
New Conventional
Purchase Details
Closed on
Aug 31, 1995
Sold by
Lacy Diane L
Bought by
Hoffmeier William J
Home Financials for this Owner
Home Financials are based on the most recent Mortgage that was taken out on this home.
Original Mortgage
$83,640
Interest Rate
7.61%
Create a Home Valuation Report for This Property
The Home Valuation Report is an in-depth analysis detailing your home's value as well as a comparison with similar homes in the area
Home Values in the Area
Average Home Value in this Area
Purchase History
| Date | Buyer | Sale Price | Title Company |
|---|---|---|---|
| Fitzpatrick John O | $274,000 | -- | |
| Foote Megan | $210,000 | -- | |
| Hoffmeier William J | $82,000 | -- |
Source: Public Records
Mortgage History
| Date | Status | Borrower | Loan Amount |
|---|---|---|---|
| Open | Fitzpatrick John O | $219,200 | |
| Previous Owner | Hoffmeier William J | $168,000 | |
| Previous Owner | Hoffmeier William J | $83,640 |
Source: Public Records
Tax History Compared to Growth
Tax History
| Year | Tax Paid | Tax Assessment Tax Assessment Total Assessment is a certain percentage of the fair market value that is determined by local assessors to be the total taxable value of land and additions on the property. | Land | Improvement |
|---|---|---|---|---|
| 2025 | $800 | $298,270 | $60,000 | $238,270 |
| 2024 | $800 | $276,180 | $55,000 | $221,180 |
| 2023 | $2,968 | $263,030 | $53,000 | $210,030 |
| 2022 | $2,920 | $255,370 | $51,000 | $204,370 |
| 2021 | $2,967 | $252,840 | $51,000 | $201,840 |
| 2020 | $2,823 | $238,530 | $48,000 | $190,530 |
| 2019 | $2,540 | $214,650 | $43,000 | $171,650 |
| 2018 | $2,595 | $225,680 | $45,000 | $180,680 |
| 2017 | $2,516 | $216,730 | $43,000 | $173,730 |
| 2016 | $2,584 | $223,070 | $45,000 | $178,070 |
| 2015 | $2,349 | $210,440 | $42,000 | $168,440 |
| 2014 | $2,633 | $236,450 | $47,000 | $189,450 |
Source: Public Records
Map
Nearby Homes
- 6509 Potomac Ave Unit A2
- 6514 10th St
- 1403 Belle View Blvd Unit B-1
- 1107 Belle View Blvd Unit A1
- 1411 Belle View Blvd Unit B1
- 6613 E Wakefield Dr Unit A1
- 6608 Potomac Ave Unit B2
- 6402 Potomac Ave
- 6430 14th St
- 6625 10th St Unit C2
- 6621 Wakefield Dr Unit 418
- 6621 Wakefield Dr Unit 910
- 6631 Wakefield Dr Unit 819
- 6631 Wakefield Dr Unit 106
- 6641 Wakefield Dr Unit 616
- 6641 Wakefield Dr Unit 801
- 6641 Wakefield Dr Unit 317
- 6641 Wakefield Dr Unit 918
- 6641 Wakefield Dr Unit 506
- 6641 Wakefield Dr Unit 405
- 6515 Potomac Ave Unit A2
- 6515 Potomac Ave Unit B1
- 6515 Potomac Ave Unit C-1
- 6517 Potomac Ave Unit B2
- 6517 Potomac Ave Unit J
- 6517 Potomac Ave Unit J1
- 6517 Potomac Ave Unit J
- 6517 Potomac Ave Unit A1
- 6517 Potomac Ave Unit B1
- 6513 Potomac Ave Unit B2
- 6513 Potomac Ave Unit A1
- 6513 Potomac Ave Unit A2
- 6511 Potomac Ave Unit B2
- 6511 Potomac Ave Unit B1
- 6511 Potomac Ave Unit C1
- 6505 Potomac Ave Unit B1
- 6505 Potomac Ave Unit A1
- 6505 Potomac Ave Unit B2
- 6505 Potomac Ave Unit A2
- 1111C I St Unit 2