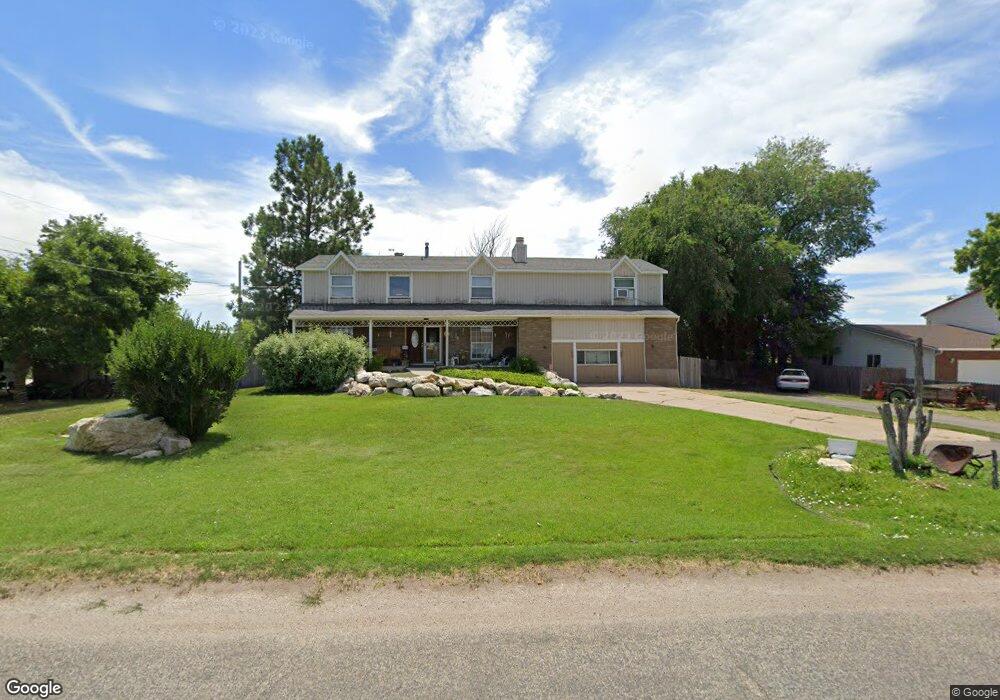
6515 W 4600 S Hooper, UT 84315
Estimated Value: $477,000 - $703,304
5
Beds
5
Baths
4,400
Sq Ft
$138/Sq Ft
Est. Value
About This Home
This home is located at 6515 W 4600 S, Hooper, UT 84315 and is currently estimated at $608,576, approximately $138 per square foot. 6515 W 4600 S is a home located in Weber County with nearby schools including Hooper Elementary School, Rocky Mountain Junior High School, and Quest Academy.
Ownership History
Date
Name
Owned For
Owner Type
Purchase Details
Closed on
Mar 22, 2007
Sold by
Williamson Ronald and Williamson Lisa
Bought by
Williamson Ronald and Williamson Lisa
Current Estimated Value
Purchase Details
Closed on
Mar 17, 2004
Sold by
Fielding Lynn A and Fielding Sheryl
Bought by
Fielding Property Management Llc
Purchase Details
Closed on
Nov 20, 2002
Sold by
Associates First Capital Corp
Bought by
Williamson Ronald and Williamson Lisa
Home Financials for this Owner
Home Financials are based on the most recent Mortgage that was taken out on this home.
Original Mortgage
$204,200
Interest Rate
6.28%
Mortgage Type
Purchase Money Mortgage
Purchase Details
Closed on
Apr 5, 2002
Sold by
Fielding Albert J
Bought by
Fielding Property Management Llc
Create a Home Valuation Report for This Property
The Home Valuation Report is an in-depth analysis detailing your home's value as well as a comparison with similar homes in the area
Home Values in the Area
Average Home Value in this Area
Purchase History
| Date | Buyer | Sale Price | Title Company |
|---|---|---|---|
| Williamson Ronald | -- | Metro National Title | |
| Fielding Property Management Llc | -- | -- | |
| Williamson Ronald | -- | First American Title | |
| Fielding Property Management Llc | -- | -- |
Source: Public Records
Mortgage History
| Date | Status | Borrower | Loan Amount |
|---|---|---|---|
| Previous Owner | Williamson Ronald | $204,200 |
Source: Public Records
Tax History
| Year | Tax Paid | Tax Assessment Tax Assessment Total Assessment is a certain percentage of the fair market value that is determined by local assessors to be the total taxable value of land and additions on the property. | Land | Improvement |
|---|---|---|---|---|
| 2025 | $1,818 | $647,722 | $485,565 | $162,157 |
| 2024 | $1,752 | $642,999 | $485,565 | $157,434 |
| 2023 | $1,811 | $559,475 | $371,003 | $188,472 |
| 2022 | $1,751 | $555,104 | $341,001 | $214,103 |
| 2021 | $1,432 | $431,001 | $267,800 | $163,201 |
| 2020 | $1,390 | $403,001 | $232,800 | $170,201 |
| 2019 | $1,494 | $395,141 | $212,864 | $182,277 |
| 2018 | $1,300 | $357,578 | $207,837 | $149,741 |
| 2017 | $1,189 | $298,396 | $169,631 | $128,765 |
| 2016 | $1,255 | $90,717 | $24,105 | $66,612 |
| 2015 | $1,198 | $85,322 | $21,882 | $63,440 |
| 2014 | $1,177 | $81,562 | $25,913 | $55,649 |
Source: Public Records
Map
Nearby Homes
- 5015 S 6700 W
- 6036 W 4700 S
- 6868 W 5100 S
- 5957 W 4700 S
- 6014 W 5300 S
- 4129 S 5800 W Unit 4
- 4146 S 5800 W Unit 5
- 4194 S 5800 W Unit 14
- 4168 S 5800 W Unit 12
- 4179 S 5800 W Unit 1
- 4163 S 5800 W Unit 2
- 3729 S 5600 W Unit 6
- 3720 S 5600 W Unit 2
- 3732 S 5600 W Unit 3
- 3719 S 5600 W Unit 7
- 4100 S 5900 W
- 5585 S 6950 W
- 0 W 5500 S
- 5577 W 4000 S
- 3842 S 5675 W
Your Personal Tour Guide
Ask me questions while you tour the home.