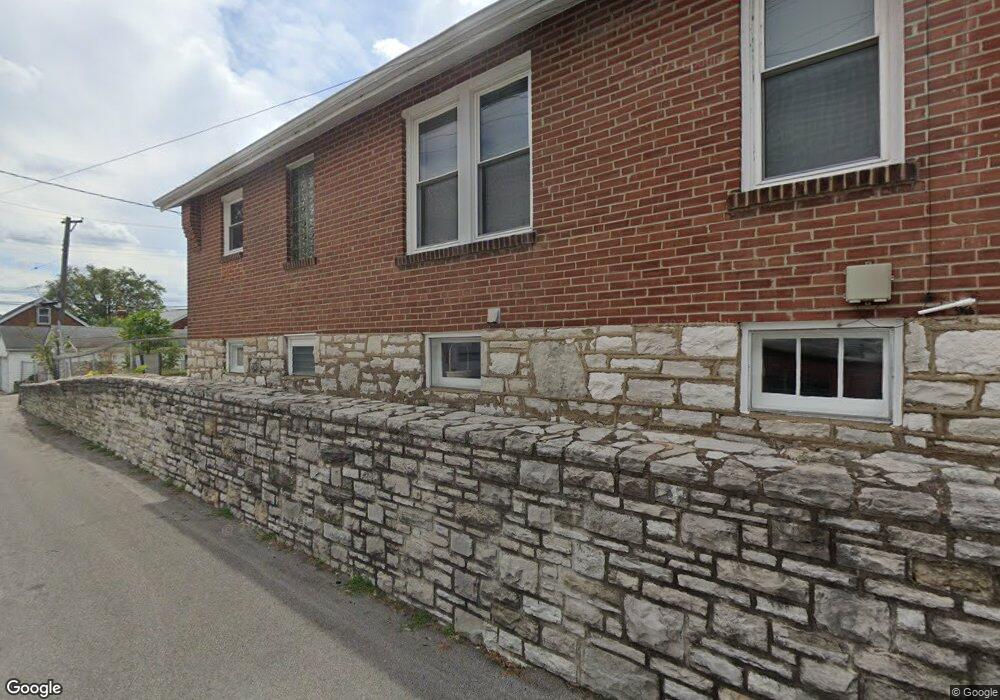
6516 Pernod Ave Saint Louis, MO 63139
Lindenwood Park NeighborhoodEstimated Value: $228,571 - $269,000
2
Beds
2
Baths
942
Sq Ft
$265/Sq Ft
Est. Value
About This Home
This home is located at 6516 Pernod Ave, Saint Louis, MO 63139 and is currently estimated at $249,643, approximately $265 per square foot. 6516 Pernod Ave is a home located in St. Louis City with nearby schools including Mason Elementary School, Long International Middle School, and Roosevelt High School.
Ownership History
Date
Name
Owned For
Owner Type
Purchase Details
Closed on
Sep 20, 2012
Sold by
Hiller Lynn and Rogers Terry
Bought by
Hudson Patrick C
Current Estimated Value
Home Financials for this Owner
Home Financials are based on the most recent Mortgage that was taken out on this home.
Original Mortgage
$103,098
Outstanding Balance
$71,508
Interest Rate
3.62%
Mortgage Type
FHA
Estimated Equity
$178,135
Purchase Details
Closed on
Dec 12, 2005
Sold by
Hiller Lynn and Roltsch Frank A
Bought by
Roltsch Frank A and Hiller Lynn
Create a Home Valuation Report for This Property
The Home Valuation Report is an in-depth analysis detailing your home's value as well as a comparison with similar homes in the area
Home Values in the Area
Average Home Value in this Area
Purchase History
| Date | Buyer | Sale Price | Title Company |
|---|---|---|---|
| Hudson Patrick C | -- | None Available | |
| Roltsch Frank A | -- | None Available |
Source: Public Records
Mortgage History
| Date | Status | Borrower | Loan Amount |
|---|---|---|---|
| Open | Hudson Patrick C | $103,098 |
Source: Public Records
Tax History Compared to Growth
Tax History
| Year | Tax Paid | Tax Assessment Tax Assessment Total Assessment is a certain percentage of the fair market value that is determined by local assessors to be the total taxable value of land and additions on the property. | Land | Improvement |
|---|---|---|---|---|
| 2025 | $2,367 | $32,860 | $3,330 | $29,530 |
| 2024 | $2,252 | $27,940 | $3,330 | $24,610 |
| 2023 | $2,252 | $27,940 | $3,330 | $24,610 |
| 2022 | $2,152 | $25,700 | $3,330 | $22,370 |
| 2021 | $2,149 | $25,700 | $3,330 | $22,370 |
| 2020 | $1,967 | $23,670 | $3,330 | $20,340 |
| 2019 | $1,960 | $23,680 | $3,330 | $20,350 |
| 2018 | $1,799 | $21,030 | $3,000 | $18,030 |
| 2017 | $1,768 | $21,030 | $3,000 | $18,030 |
| 2016 | $1,597 | $18,720 | $3,000 | $15,710 |
| 2015 | $1,449 | $18,710 | $3,000 | $15,710 |
| 2014 | $1,387 | $18,710 | $3,000 | $15,710 |
| 2013 | -- | $17,920 | $3,000 | $14,920 |
Source: Public Records
Map
Nearby Homes
- 6517 Tholozan Ave
- 6439 Mardel Ave
- 6541 Lindenwood Place
- 6621 Tholozan Ave
- 6611 Pernod Ave
- 6631 Pernod Ave
- 3905 Tamm Ave
- 6659 Tholozan Ave
- 6656 Oleatha Ave
- 6214 Oleatha Ave
- 6339 Marquette Ave
- 6561 Bancroft Ave
- 6325 Marquette Ave
- 6437 Hancock Ave
- 6625 Hancock Ave
- 6411 Hancock Ave
- 6653 Hancock Ave
- 6041 Tholozan Ave
- 6409 Sutherland Ave
- 6811 Marquette Ave
- 6520 Pernod Ave
- 6524 Pernod Ave
- 6528 Pernod Ave
- 3613 Watson Rd
- 6532 Pernod Ave
- 3617 Watson Rd
- 6519 Tholozan Ave
- 6521 Tholozan Ave
- 3621 Watson Rd
- 6536 Pernod Ave
- 6515 Pernod Ave
- 6525 Tholozan Ave
- 6519 Pernod Ave
- 6521 Pernod Ave
- 6531 Tholozan Ave
- 3625 Watson Rd
- 6527 Pernod Ave
- 6540 Pernod Ave
- 6533 Tholozan Ave
- 6531 Pernod Ave