6517 Flatwoods Bay Ct Las Vegas, NV 89122
Estimated Value: $350,000 - $370,000
4
Beds
2
Baths
1,415
Sq Ft
$253/Sq Ft
Est. Value
About This Home
This home is located at 6517 Flatwoods Bay Ct, Las Vegas, NV 89122 and is currently estimated at $357,775, approximately $252 per square foot. 6517 Flatwoods Bay Ct is a home located in Clark County with nearby schools including Jenkins Earl N. Elementary School, Kathleen & Tim Harney Middle School, and Chaparral High School.
Ownership History
Date
Name
Owned For
Owner Type
Purchase Details
Closed on
Nov 9, 2010
Sold by
The Secretary Of Housing & Urban Develop
Bought by
Cabrera Alberto and Cabrera Martha
Current Estimated Value
Home Financials for this Owner
Home Financials are based on the most recent Mortgage that was taken out on this home.
Original Mortgage
$84,857
Outstanding Balance
$56,272
Interest Rate
4.37%
Mortgage Type
FHA
Estimated Equity
$301,503
Purchase Details
Closed on
Jun 3, 2010
Sold by
Pennington Naengnoi and Kraithong Prapai
Bought by
Bac Home Loans Servicing Lp and Countrywide Home Loans Servicing Lp
Purchase Details
Closed on
Jun 27, 2005
Sold by
Woodside Sunrise At Riverwalk Llc
Bought by
Pennington Naengnoi and Kriathong Prapai
Home Financials for this Owner
Home Financials are based on the most recent Mortgage that was taken out on this home.
Original Mortgage
$212,135
Interest Rate
5.65%
Mortgage Type
FHA
Create a Home Valuation Report for This Property
The Home Valuation Report is an in-depth analysis detailing your home's value as well as a comparison with similar homes in the area
Home Values in the Area
Average Home Value in this Area
Purchase History
| Date | Buyer | Sale Price | Title Company |
|---|---|---|---|
| Cabrera Alberto | $88,000 | Nevada Title Las Vegas | |
| Bac Home Loans Servicing Lp | $221,144 | Fidelity National Default S | |
| The Secretary Of Housing & Urban Develop | $221,144 | Fidelity National Default S | |
| Pennington Naengnoi | $261,284 | Chicago Title |
Source: Public Records
Mortgage History
| Date | Status | Borrower | Loan Amount |
|---|---|---|---|
| Open | Cabrera Alberto | $84,857 | |
| Previous Owner | Pennington Naengnoi | $212,135 |
Source: Public Records
Tax History Compared to Growth
Tax History
| Year | Tax Paid | Tax Assessment Tax Assessment Total Assessment is a certain percentage of the fair market value that is determined by local assessors to be the total taxable value of land and additions on the property. | Land | Improvement |
|---|---|---|---|---|
| 2025 | $1,344 | $93,097 | $23,800 | $69,297 |
| 2024 | $1,245 | $93,097 | $23,800 | $69,297 |
| 2023 | $829 | $93,463 | $28,000 | $65,463 |
| 2022 | $1,153 | $83,455 | $23,800 | $59,655 |
| 2021 | $1,068 | $76,995 | $20,300 | $56,695 |
| 2020 | $989 | $76,150 | $19,950 | $56,200 |
| 2019 | $927 | $71,638 | $16,450 | $55,188 |
| 2018 | $884 | $60,377 | $13,650 | $46,727 |
| 2017 | $1,584 | $54,016 | $11,550 | $42,466 |
| 2016 | $829 | $47,151 | $9,800 | $37,351 |
| 2015 | $826 | $33,110 | $6,300 | $26,810 |
| 2014 | $801 | $28,277 | $4,375 | $23,902 |
Source: Public Records
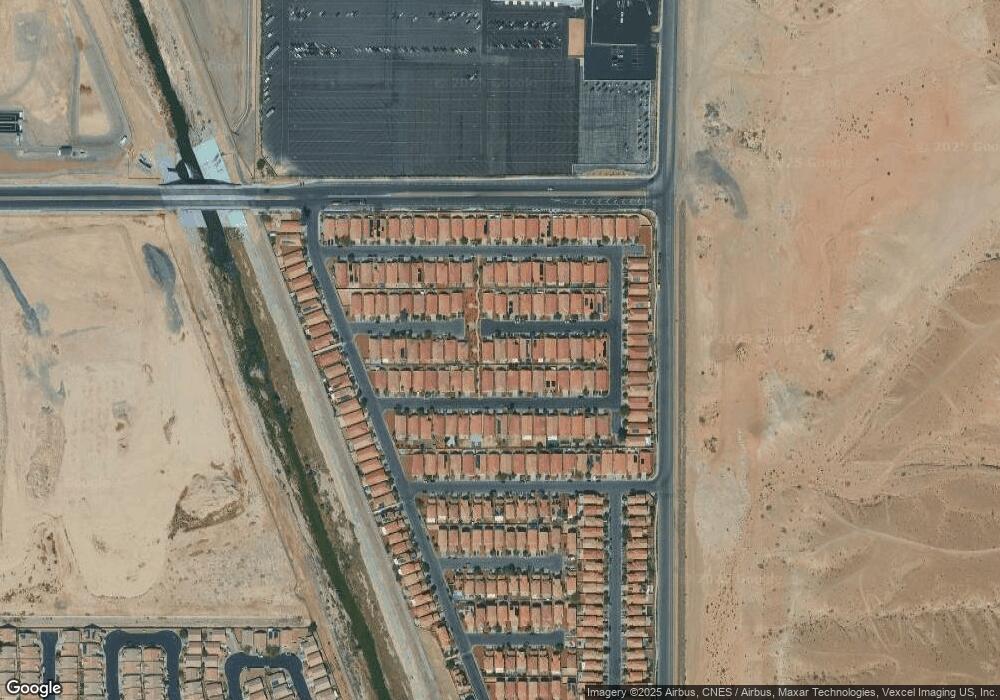
Map
Nearby Homes
- 6549 Slate Springs Ct
- 3329 Glacial Lake St
- 6578 Charlie Chaplin Ave Unit 102
- 3357 Sheep Canyon St
- 3568 Gloucester Gate St
- 3520 Tack St
- 3592 Gloucester Gate St
- 3608 Tundra Swan St
- 6094 Majestic Wind Ave
- 6580 Clara Bow Ave Unit 103
- 6433 Buck Jones Ave Unit 103
- 6085 Majestic Wind Ave
- 6430 Jackrabbit Run Ave
- 6092 Fox Creek Ave
- 6128 Isola Peak Ave
- 6228 Wood Stork Ave
- 3739 Squirrel St
- 3447 Halter Dr
- 6064 Isola Peak Ave
- 6436 Swift Fox Ct
- 6523 Flatwoods Bay Ct
- 6511 Flatwoods Bay Ct
- 6522 Coldwater Bay Dr
- 6528 Coldwater Bay Dr Unit 3
- 6516 Coldwater Bay Dr
- 6535 Flatwoods Bay Ct
- 6497 Abbeville River Ct
- 6534 Coldwater Bay Dr
- 6534 Coldwater Bay Dr Unit n/a
- 6534 Coldwater Bay Dr
- 6518 Flatwoods Bay Ct
- 6504 Coldwater Bay Dr
- 6524 Flatwoods Bay Ct Unit 3
- 6512 Flatwoods Bay Ct
- 6540 Coldwater Bay Dr
- 6541 Flatwoods Bay Ct
- 6491 Abbeville River Ct
- 6491 Abbeville River Ct Unit None
- 6491 Abbeville River Ct Unit n
- 6530 Flatwoods Bay Ct