6517 N Main St Houston, TX 77009
Greater Heights NeighborhoodEstimated Value: $395,443 - $531,000
2
Beds
1
Bath
672
Sq Ft
$680/Sq Ft
Est. Value
About This Home
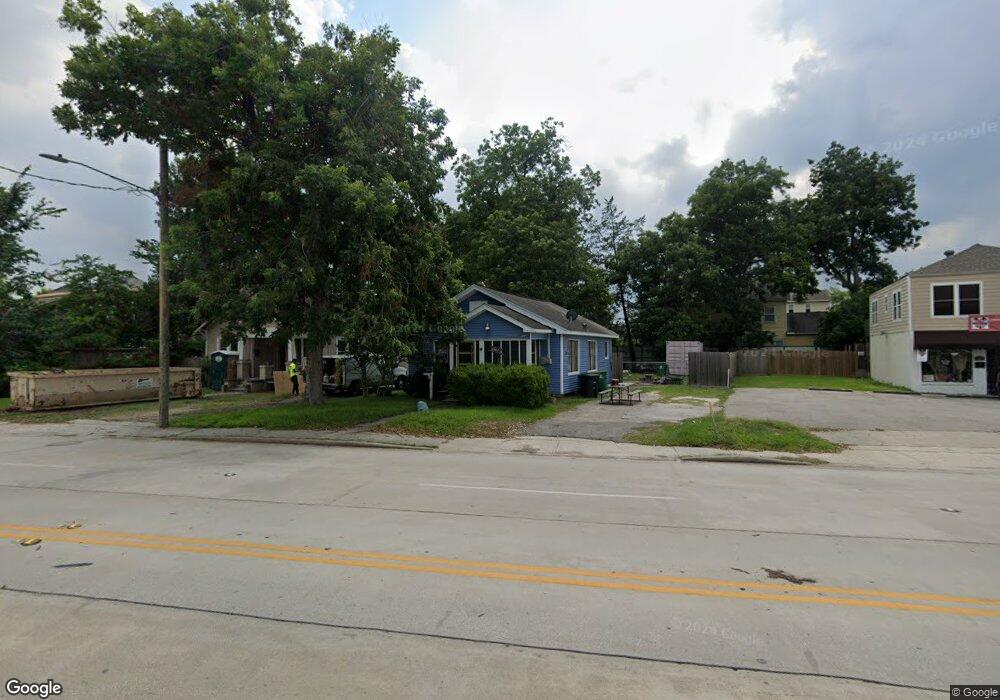
This home is located at 6517 N Main St, Houston, TX 77009 and is currently estimated at $456,861, approximately $679 per square foot. 6517 N Main St is a home located in Harris County with nearby schools including Field Elementary School, Hamilton Middle, and Heights High School.
Ownership History
Date
Name
Owned For
Owner Type
Purchase Details
Closed on
Nov 29, 2005
Sold by
Palermo Anthony John and Palermo Mary Ann
Bought by
Vanallen Kerry and Allen Susan
Current Estimated Value
Home Financials for this Owner
Home Financials are based on the most recent Mortgage that was taken out on this home.
Original Mortgage
$160,000
Outstanding Balance
$87,573
Interest Rate
6.12%
Mortgage Type
Purchase Money Mortgage
Estimated Equity
$369,288
Create a Home Valuation Report for This Property
The Home Valuation Report is an in-depth analysis detailing your home's value as well as a comparison with similar homes in the area
Home Values in the Area
Average Home Value in this Area
Purchase History
| Date | Buyer | Sale Price | Title Company |
|---|---|---|---|
| Vanallen Kerry | -- | Stewart Title |
Source: Public Records
Mortgage History
| Date | Status | Borrower | Loan Amount |
|---|---|---|---|
| Open | Vanallen Kerry | $160,000 |
Source: Public Records
Tax History Compared to Growth
Tax History
| Year | Tax Paid | Tax Assessment Tax Assessment Total Assessment is a certain percentage of the fair market value that is determined by local assessors to be the total taxable value of land and additions on the property. | Land | Improvement |
|---|---|---|---|---|
| 2025 | $10,548 | $573,295 | $487,645 | $85,650 |
| 2024 | $10,548 | $504,110 | $430,275 | $73,835 |
| 2023 | $10,548 | $482,785 | $401,590 | $81,195 |
| 2022 | $8,646 | $392,683 | $332,746 | $59,937 |
| 2021 | $8,562 | $367,375 | $315,535 | $51,840 |
| 2020 | $8,633 | $356,500 | $315,535 | $40,965 |
| 2019 | $8,765 | $346,372 | $315,535 | $30,837 |
| 2018 | $8,249 | $325,989 | $298,324 | $27,665 |
| 2017 | $8,243 | $325,989 | $298,324 | $27,665 |
| 2016 | $7,692 | $304,211 | $276,546 | $27,665 |
| 2015 | $5,592 | $266,984 | $239,319 | $27,665 |
| 2014 | $5,592 | $217,523 | $191,455 | $26,068 |
Source: Public Records
Map
Nearby Homes