6519 41st St E Fife, WA 98424
East Fife NeighborhoodEstimated Value: $625,000 - $682,000
5
Beds
3
Baths
2,952
Sq Ft
$221/Sq Ft
Est. Value
About This Home
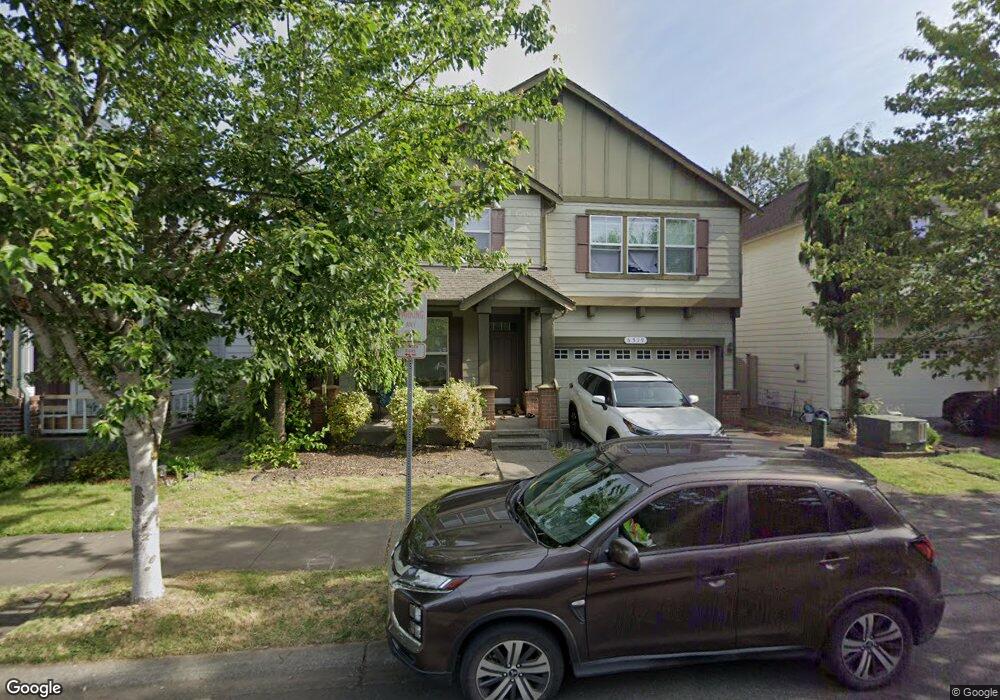
This home is located at 6519 41st St E, Fife, WA 98424 and is currently estimated at $652,576, approximately $221 per square foot. 6519 41st St E is a home located in Pierce County with nearby schools including Endeavour Intermediate School, Columbia Junior High School, and Surprise Lake Middle School.
Ownership History
Date
Name
Owned For
Owner Type
Purchase Details
Closed on
Nov 25, 2014
Sold by
Ah4r I Wa Llc
Bought by
Amh 2014-3 Borrower Llc
Current Estimated Value
Home Financials for this Owner
Home Financials are based on the most recent Mortgage that was taken out on this home.
Original Mortgage
$528,418,000
Outstanding Balance
$405,211,983
Interest Rate
3.95%
Mortgage Type
Purchase Money Mortgage
Estimated Equity
-$404,559,407
Purchase Details
Closed on
Jan 10, 2013
Sold by
Lorenzen James D and Lorenzen Hyon S
Bought by
Ah4r I Wa Llc
Purchase Details
Closed on
Jun 19, 2006
Sold by
Sshi Llc
Bought by
Lorenzen James D and Lorenzen Hyon S
Home Financials for this Owner
Home Financials are based on the most recent Mortgage that was taken out on this home.
Original Mortgage
$347,462
Interest Rate
6.57%
Mortgage Type
Purchase Money Mortgage
Create a Home Valuation Report for This Property
The Home Valuation Report is an in-depth analysis detailing your home's value as well as a comparison with similar homes in the area
Home Values in the Area
Average Home Value in this Area
Purchase History
| Date | Buyer | Sale Price | Title Company |
|---|---|---|---|
| Amh 2014-3 Borrower Llc | -- | Fidelity Natl Title Group | |
| Ah4r I Wa Llc | $196,000 | None Available | |
| Lorenzen James D | $373,326 | Chicago Title Insurance Co |
Source: Public Records
Mortgage History
| Date | Status | Borrower | Loan Amount |
|---|---|---|---|
| Open | Amh 2014-3 Borrower Llc | $528,418,000 | |
| Previous Owner | Lorenzen James D | $347,462 |
Source: Public Records
Tax History Compared to Growth
Tax History
| Year | Tax Paid | Tax Assessment Tax Assessment Total Assessment is a certain percentage of the fair market value that is determined by local assessors to be the total taxable value of land and additions on the property. | Land | Improvement |
|---|---|---|---|---|
| 2025 | $5,452 | $605,000 | $230,000 | $375,000 |
| 2024 | $5,452 | $607,500 | $186,900 | $420,600 |
| 2023 | $5,452 | $576,900 | $186,900 | $390,000 |
| 2022 | $5,764 | $605,800 | $193,500 | $412,300 |
| 2021 | $5,629 | $444,700 | $129,000 | $315,700 |
| 2019 | $4,731 | $412,100 | $105,100 | $307,000 |
| 2018 | $4,414 | $388,000 | $92,900 | $295,100 |
| 2017 | $3,724 | $358,900 | $77,200 | $281,700 |
| 2016 | $3,236 | $274,400 | $56,700 | $217,700 |
| 2014 | $2,844 | $252,100 | $48,900 | $203,200 |
| 2013 | $2,844 | $213,800 | $39,100 | $174,700 |
Source: Public Records
Map
Nearby Homes
- 6827 41st St E
- 3829 60th Ave E
- 6345 Park St E
- 0 66th Ave E Unit NWM2452047
- 7102 49th St E Unit 3
- 6314 Valley Ave E
- 5817 Acclaimation St E
- 7103 56th St E
- 2724 58th Ave E
- 5011 79th Avenue Ct E Unit 19
- 1420 32nd St NW
- 1541 27th St NW
- 1533 27th St NW
- 5029 80th Avenue Ct E Unit 6
- 8314 38th St E Unit 4
- 8406 37th Street Ct E Unit 39
- 2406 54th Ave E
- 6505 Stewart Ave E
- 2720 13th Ave NW
- 5805 51st Avenue Ct E
- 6507 41st St E
- 6531 41st St E
- 6543 41st St E
- 6468 40th Street Ct E
- 6456 40th St E
- 6516 41st St E
- 6447 41st St E
- 6536 41st St E
- 6444 40th St E
- 6442 41st St E
- 6435 41st St E
- 4039 64th Ave E
- 4109 65th Ave E
- 6430 40th St E
- 6434 41st St E
- 4104 65th Avenue Ct E
- 6423 41st St E
- 4033 64th Ave E
- 6426 41st St E