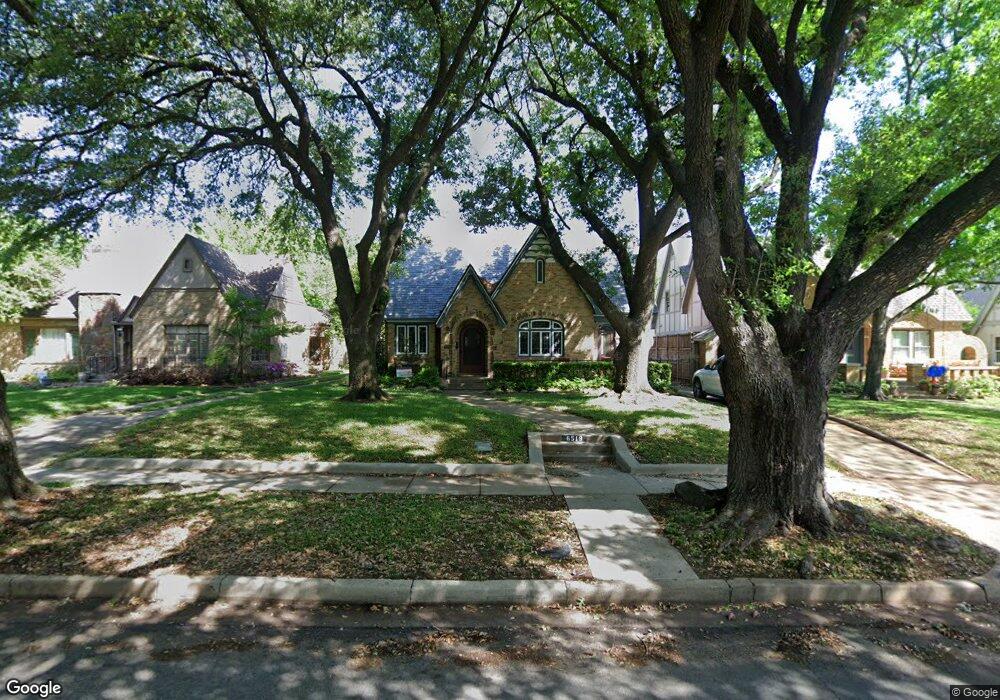
6519 Lakeshore Dr Dallas, TX 75214
Lakewood NeighborhoodEstimated Value: $911,000 - $1,102,000
3
Beds
2
Baths
1,696
Sq Ft
$582/Sq Ft
Est. Value
About This Home
This home is located at 6519 Lakeshore Dr, Dallas, TX 75214 and is currently estimated at $987,365, approximately $582 per square foot. 6519 Lakeshore Dr is a home located in Dallas County with nearby schools including Lakewood Elementary School, J L Long Middle School, and Woodrow Wilson High School.
Ownership History
Date
Name
Owned For
Owner Type
Purchase Details
Closed on
Jun 30, 2023
Sold by
Hutcheson Tearlach D
Bought by
Cluley Erin Teresa
Current Estimated Value
Purchase Details
Closed on
May 1, 2017
Sold by
Covey Adrian and Roberts Olivia
Bought by
Hutcheson Tearlach D
Home Financials for this Owner
Home Financials are based on the most recent Mortgage that was taken out on this home.
Original Mortgage
$416,000
Interest Rate
4.23%
Mortgage Type
New Conventional
Purchase Details
Closed on
Nov 18, 2016
Sold by
Lacy Jeremy Marcus
Bought by
Covey Adrian and Roberts Olivia
Home Financials for this Owner
Home Financials are based on the most recent Mortgage that was taken out on this home.
Original Mortgage
$74,985
Interest Rate
3.42%
Mortgage Type
Stand Alone Second
Purchase Details
Closed on
Jul 6, 2000
Sold by
Lacy Jeremy Marcus
Bought by
Lacy Deborah P
Create a Home Valuation Report for This Property
The Home Valuation Report is an in-depth analysis detailing your home's value as well as a comparison with similar homes in the area
Home Values in the Area
Average Home Value in this Area
Purchase History
| Date | Buyer | Sale Price | Title Company |
|---|---|---|---|
| Cluley Erin Teresa | -- | None Listed On Document | |
| Hutcheson Tearlach D | -- | Allegiance Title | |
| Covey Adrian | -- | None Available | |
| Lacy Deborah P | -- | -- |
Source: Public Records
Mortgage History
| Date | Status | Borrower | Loan Amount |
|---|---|---|---|
| Previous Owner | Hutcheson Tearlach D | $416,000 | |
| Previous Owner | Covey Adrian | $74,985 |
Source: Public Records
Tax History Compared to Growth
Tax History
| Year | Tax Paid | Tax Assessment Tax Assessment Total Assessment is a certain percentage of the fair market value that is determined by local assessors to be the total taxable value of land and additions on the property. | Land | Improvement |
|---|---|---|---|---|
| 2025 | $14,103 | $836,170 | $423,000 | $413,170 |
| 2024 | $14,103 | $836,170 | $423,000 | $413,170 |
| 2023 | $14,103 | $836,970 | $500,000 | $336,970 |
| 2022 | $20,187 | $807,370 | $500,000 | $307,370 |
| 2021 | $14,344 | $543,740 | $400,000 | $143,740 |
| 2020 | $14,751 | $543,740 | $400,000 | $143,740 |
| 2019 | $15,471 | $543,740 | $400,000 | $143,740 |
| 2018 | $14,785 | $543,740 | $400,000 | $143,740 |
| 2017 | $13,511 | $496,870 | $350,000 | $146,870 |
| 2016 | $10,600 | $389,790 | $300,000 | $89,790 |
| 2015 | $7,108 | $361,800 | $260,000 | $101,800 |
| 2014 | $7,108 | $336,820 | $220,000 | $116,820 |
Source: Public Records
Map
Nearby Homes
- 6334 Velasco Ave
- 6339 Velasco Ave
- 6630 Lakewood Blvd
- 6326 Lakeshore Dr
- 6402 Lakewood Blvd
- 4 Nonesuch Rd
- 6666 Lakewood Blvd
- 6333 Richmond Ave Unit D
- 6329 Richmond Ave
- 6254 Goliad Ave
- 6235 Palo Pinto Ave
- 6318 Richmond Ave Unit 4202D
- 6318 Richmond Ave Unit 4203D
- 6234 Lakeshore Dr
- 6227 Lakeshore Dr
- 6708 Avalon Ave
- 6215 Llano Ave
- 6424 Marquita Ave
- 6303 Prospect Ave Unit B104
- 6218 Lakeshore Dr
- 6521 Lakeshore Dr
- 6513 Lakeshore Dr
- 6527 Lakeshore Dr
- 2424 Hillside Dr
- 2502 Hillside Dr
- 6531 Lakeshore Dr
- 6505 Lakeshore Dr
- 2506 Hillside Dr
- 6518 Lakeshore Dr
- 6514 Lakeshore Dr
- 6533 Lakeshore Dr
- 6522 Lakeshore Dr
- 6510 Lakeshore Dr
- 6532 Lakeshore Dr
- 2510 Hillside Dr
- 6506 Lakeshore Dr
- 2503 Cambria Blvd
- 6434 Glenrose Ct
- 6443 Glenrose Ct
- 2505 Hillside Dr