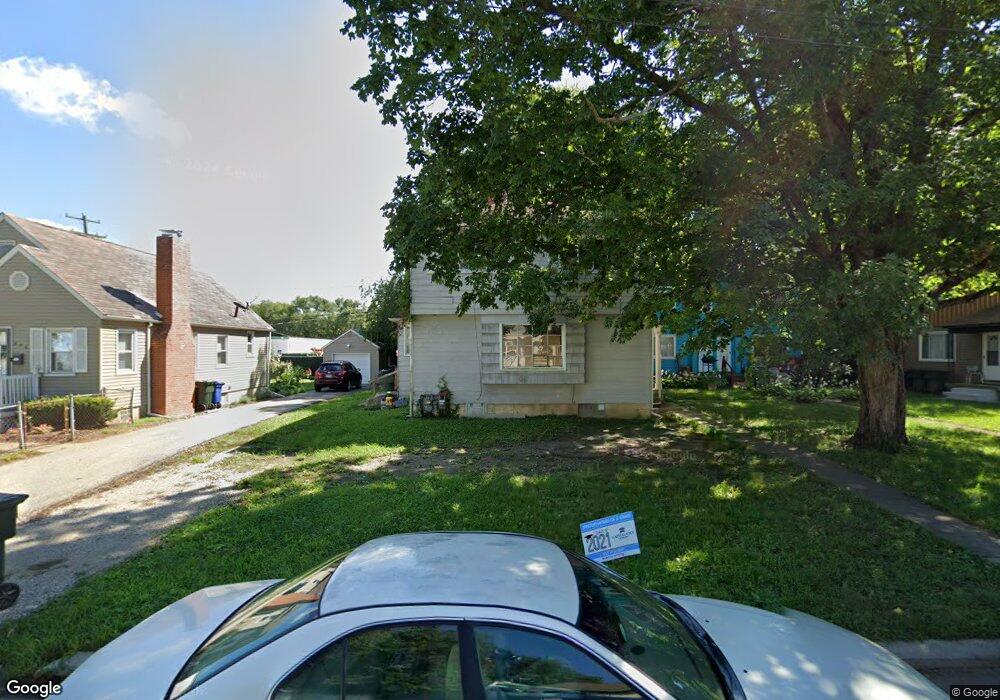
652-654 Rhoads Ave Columbus, OH 43205
South of Main NeighborhoodEstimated Value: $188,000 - $268,000
4
Beds
2
Baths
1,707
Sq Ft
$133/Sq Ft
Est. Value
About This Home
This home is located at 652-654 Rhoads Ave, Columbus, OH 43205 and is currently estimated at $227,111, approximately $133 per square foot. 652-654 Rhoads Ave is a home located in Franklin County with nearby schools including Ohio Avenue Elementary School, Champion Middle School, and East High School.
Ownership History
Date
Name
Owned For
Owner Type
Purchase Details
Closed on
Mar 14, 2016
Sold by
Robinson Bruce
Bought by
Ngi Llc
Current Estimated Value
Purchase Details
Closed on
Mar 5, 2012
Sold by
Fannie Mae
Bought by
Robinson Bruce
Purchase Details
Closed on
Dec 23, 2011
Sold by
Jennings Lafleche Ginette
Bought by
Federal National Mortgage Association
Purchase Details
Closed on
Jan 31, 2010
Sold by
Lafeche Ginette and Jennings David
Bought by
Russell 2K Llc
Purchase Details
Closed on
Feb 28, 2000
Sold by
Home Investors Inc
Bought by
Jennings David and Jennings Lafleche Ginnete
Purchase Details
Closed on
Nov 17, 1999
Sold by
Yinger Harold
Bought by
Home Investors Inc
Purchase Details
Closed on
Apr 1, 1984
Create a Home Valuation Report for This Property
The Home Valuation Report is an in-depth analysis detailing your home's value as well as a comparison with similar homes in the area
Home Values in the Area
Average Home Value in this Area
Purchase History
| Date | Buyer | Sale Price | Title Company |
|---|---|---|---|
| Ngi Llc | $12,500 | None Available | |
| Robinson Bruce | $7,200 | Attorney | |
| Federal National Mortgage Association | $16,000 | None Available | |
| Russell 2K Llc | -- | Attorney | |
| Lafleche Ginette | -- | Attorney | |
| Jennings David | $69,000 | -- | |
| Home Investors Inc | $28,100 | -- | |
| -- | $22,900 | -- |
Source: Public Records
Tax History Compared to Growth
Tax History
| Year | Tax Paid | Tax Assessment Tax Assessment Total Assessment is a certain percentage of the fair market value that is determined by local assessors to be the total taxable value of land and additions on the property. | Land | Improvement |
|---|---|---|---|---|
| 2024 | $2,336 | $50,970 | $23,000 | $27,970 |
| 2023 | $2,307 | $50,970 | $23,000 | $27,970 |
| 2022 | $733 | $13,790 | $1,820 | $11,970 |
| 2021 | $856 | $13,790 | $1,820 | $11,970 |
| 2020 | $782 | $13,790 | $1,820 | $11,970 |
| 2019 | $767 | $11,520 | $1,540 | $9,980 |
| 2018 | $358 | $11,520 | $1,540 | $9,980 |
| 2017 | $804 | $11,520 | $1,540 | $9,980 |
| 2016 | $735 | $10,820 | $2,800 | $8,020 |
| 2015 | $371 | $10,820 | $2,800 | $8,020 |
| 2014 | $671 | $10,820 | $2,800 | $8,020 |
| 2013 | $461 | $11,375 | $2,940 | $8,435 |
Source: Public Records
Map
Nearby Homes
- 1800 E Fulton St
- 572 Bulen Ave
- 639 Bulen Ave
- 1747 E Mound St
- 751 Bulen Ave
- 1779 E Main St
- 849 Lyman Ave
- 623 Seymour Ave
- 1751 Bide A Wee Park Ave
- 707 Seymour Ave
- 756 Seymour Ave
- 711 Seymour Ave
- 780-782 Seymour Ave
- 688 Berkeley Rd
- 1825-1827 Bryden Rd
- 547 Berkeley Rd
- 395-397 Stoddart Ave
- 768 Berkeley Rd
- 782 Berkeley Rd
- 0 Lilley Ave
- 652 Rhoads Ave Unit 654
- 658 Rhoads Ave Unit 660
- 646 Rhoads Ave
- 666 Rhoads Ave
- 664 Rhoads Ave Unit 666
- 664-666 Rhoads Ave
- 640 Rhoads Ave
- 670 Rhoads Ave
- 653 Rhoads Ave
- 634 Rhoads Ave
- 651 Rhoads Ave Unit 653
- 645-647 Rhoads Ave
- 645 Rhoads Ave Unit 647
- 659 Rhoads Ave
- 676 Rhoads Ave Unit 678
- 676 Rhoads Ave Unit 8
- 639 Rhoads Ave
- 667 Rhoads Ave
- 665 Rhoads Ave Unit 667
- 665-667 Rhoads Ave