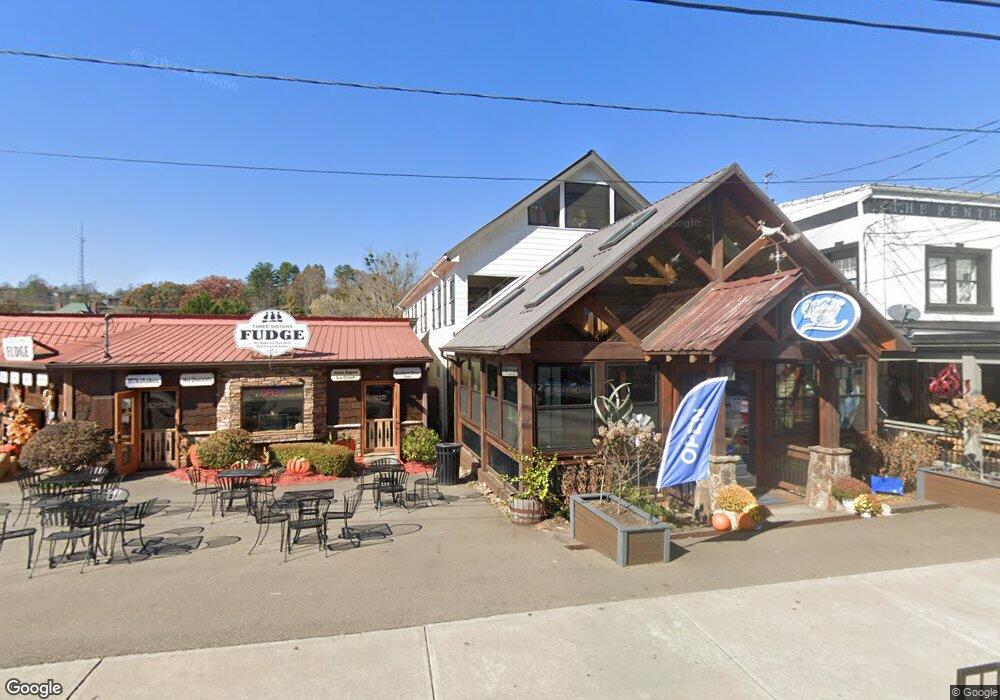
652 E Main St Blue Ridge, GA 30513
Estimated Value: $2,281,653
--
Bed
--
Bath
4,000
Sq Ft
$570/Sq Ft
Est. Value
About This Home
This home is located at 652 E Main St, Blue Ridge, GA 30513 and is currently estimated at $2,281,653, approximately $570 per square foot. 652 E Main St is a home located in Fannin County with nearby schools including Fannin County High School and Fannin Christian Learning Center.
Ownership History
Date
Name
Owned For
Owner Type
Purchase Details
Closed on
Aug 1, 2014
Sold by
Brunson Morton Investments
Bought by
Cass Publications Llc
Current Estimated Value
Purchase Details
Closed on
Jan 22, 2008
Sold by
The Downtown Team Llc
Bought by
Brunson Michael W and Morton Jack R
Purchase Details
Closed on
Jan 16, 2008
Sold by
Darden Irene Hanken
Bought by
The Downtown Team Llc
Purchase Details
Closed on
Sep 10, 2006
Sold by
Nicholson Jody L
Bought by
The Downtown Team Llc
Purchase Details
Closed on
May 14, 2004
Sold by
Darden Irene Hanken
Bought by
Nicholson Jody L
Purchase Details
Closed on
Jan 11, 2001
Sold by
Mackay Gary P and Mackay Kay
Bought by
Darden Irene Hanken
Purchase Details
Closed on
Mar 17, 2000
Sold by
Mackay Gary and Mackay Kay
Bought by
Darden Irene Hanken
Purchase Details
Closed on
Aug 27, 1999
Sold by
Broyles Sammy
Bought by
Mackay Gary and Mackay Kay
Purchase Details
Closed on
Jun 5, 1998
Sold by
Broyles Sammy
Bought by
Mackay Gary and Mackay Kay
Create a Home Valuation Report for This Property
The Home Valuation Report is an in-depth analysis detailing your home's value as well as a comparison with similar homes in the area
Home Values in the Area
Average Home Value in this Area
Purchase History
| Date | Buyer | Sale Price | Title Company |
|---|---|---|---|
| Cass Publications Llc | $750,000 | -- | |
| Brunson Michael W | $583,000 | -- | |
| Wrapsody In Blue Llc | -- | -- | |
| The Downtown Team Llc | -- | -- | |
| The Downtown Team Llc | -- | -- | |
| Nicholson Jody L | $395,000 | -- | |
| Darden Irene Hanken | -- | -- | |
| Darden Irene Hanken | $385,000 | -- | |
| Mackay Gary | -- | -- | |
| Mackay Gary | -- | -- |
Source: Public Records
Tax History Compared to Growth
Tax History
| Year | Tax Paid | Tax Assessment Tax Assessment Total Assessment is a certain percentage of the fair market value that is determined by local assessors to be the total taxable value of land and additions on the property. | Land | Improvement |
|---|---|---|---|---|
| 2024 | $1,900 | $146,232 | $35,666 | $110,566 |
| 2023 | $1,491 | $146,232 | $35,666 | $110,566 |
| 2022 | $1,491 | $146,232 | $35,666 | $110,566 |
| 2021 | $2,818 | $201,011 | $108,000 | $93,011 |
| 2020 | $2,865 | $201,011 | $108,000 | $93,011 |
| 2019 | $2,921 | $201,011 | $108,000 | $93,011 |
| 2018 | $3,139 | $203,722 | $108,000 | $95,722 |
| 2017 | $4,745 | $204,774 | $108,000 | $96,774 |
Source: Public Records
Map
Nearby Homes
- 0 Grove Loop Unit 47
- 116 W Main St Unit 2A
- 116 W Main St
- 116 W Main St Unit STE 2A
- 477 W First St
- 1 E Main St
- 353 W First St
- Lot 2 Ridges of Blue Ridge
- Lot 19 E 2nd St
- 154 Mountain St
- 51 Grove Loop
- 100 Haven Ln
- 225 Grand Vista Dr
- Lot 12 The Heights
- 2 & 2A Weymans Way
- Unit 2 Grove Loop
- 742 E 2nd St
- 160 Mountain St
- 426 Austin St
- 12 Mountain St