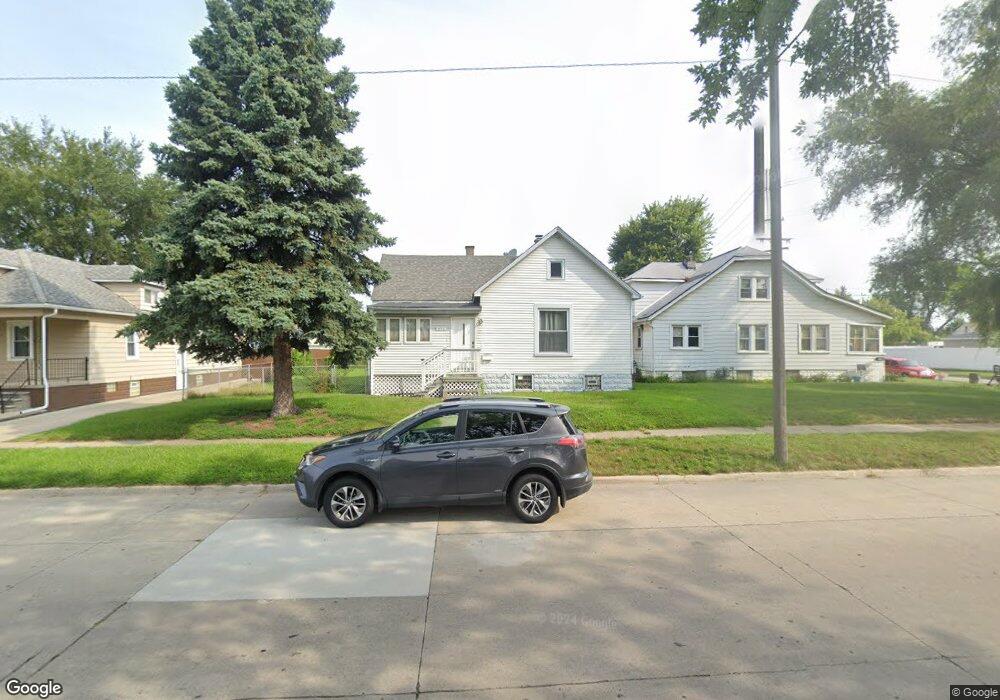
652 Goddard St Wyandotte, MI 48192
Estimated Value: $160,000 - $177,386
--
Bed
--
Bath
850
Sq Ft
$201/Sq Ft
Est. Value
About This Home
This home is located at 652 Goddard St, Wyandotte, MI 48192 and is currently estimated at $170,847, approximately $200 per square foot. 652 Goddard St is a home located in Wayne County with nearby schools including Jefferson Elementary School, Woodrow Wilson School, and Roosevelt High School.
Ownership History
Date
Name
Owned For
Owner Type
Purchase Details
Closed on
Jan 17, 2006
Sold by
Hud
Bought by
Saaidi Khaled
Current Estimated Value
Purchase Details
Closed on
Dec 30, 2004
Sold by
National City Mortgage Co
Bought by
Hud
Purchase Details
Closed on
Jun 23, 2004
Sold by
Pauline Benjamin G and Pauline Rebecca L
Bought by
National City Mortgage Co and Commonwealth United Mortgage Co
Purchase Details
Closed on
Aug 26, 2003
Sold by
Pauline Rebecca L
Bought by
Pauline Benjamin G
Purchase Details
Closed on
Sep 30, 1997
Sold by
Miller Christann J
Bought by
Benjamin G and Benjamin Pauline Rebecca
Create a Home Valuation Report for This Property
The Home Valuation Report is an in-depth analysis detailing your home's value as well as a comparison with similar homes in the area
Home Values in the Area
Average Home Value in this Area
Purchase History
| Date | Buyer | Sale Price | Title Company |
|---|---|---|---|
| Saaidi Khaled | $53,000 | None Available | |
| Hud | -- | -- | |
| National City Mortgage Co | $105,745 | -- | |
| Pauline Benjamin G | -- | -- | |
| Benjamin G | $46,020 | -- |
Source: Public Records
Tax History Compared to Growth
Tax History
| Year | Tax Paid | Tax Assessment Tax Assessment Total Assessment is a certain percentage of the fair market value that is determined by local assessors to be the total taxable value of land and additions on the property. | Land | Improvement |
|---|---|---|---|---|
| 2025 | $1,859 | $85,800 | $0 | $0 |
| 2024 | $1,859 | $74,900 | $0 | $0 |
| 2023 | $1,739 | $67,300 | $0 | $0 |
| 2022 | $2,236 | $60,200 | $0 | $0 |
| 2021 | $2,602 | $52,500 | $0 | $0 |
| 2020 | $2,154 | $45,900 | $0 | $0 |
| 2019 | $2,122 | $45,200 | $0 | $0 |
| 2018 | $1,530 | $31,300 | $0 | $0 |
| 2017 | $1,062 | $31,300 | $0 | $0 |
| 2016 | $2,039 | $31,300 | $0 | $0 |
| 2015 | $2,746 | $29,100 | $0 | $0 |
| 2013 | $2,660 | $26,600 | $0 | $0 |
| 2012 | $1,518 | $27,900 | $9,300 | $18,600 |
Source: Public Records
Map
Nearby Homes