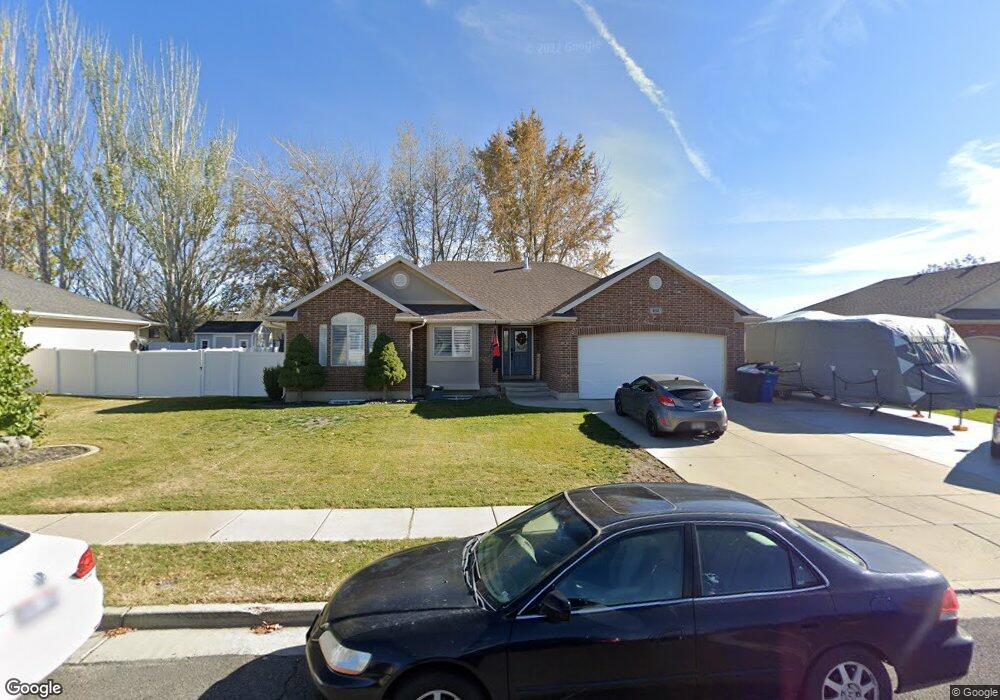
652 N 2750 W Clearfield, UT 84015
Estimated Value: $590,734 - $658,000
5
Beds
3
Baths
3,113
Sq Ft
$198/Sq Ft
Est. Value
About This Home
This home is located at 652 N 2750 W, Clearfield, UT 84015 and is currently estimated at $615,434, approximately $197 per square foot. 652 N 2750 W is a home located in Davis County with nearby schools including Lakeside School, West Point Junior High School, and Syracuse High School.
Ownership History
Date
Name
Owned For
Owner Type
Purchase Details
Closed on
Jun 3, 2019
Sold by
Thompson Trudi
Bought by
Gregg Kyle and Gregg Erica Lou
Current Estimated Value
Home Financials for this Owner
Home Financials are based on the most recent Mortgage that was taken out on this home.
Original Mortgage
$368,207
Outstanding Balance
$331,664
Interest Rate
5.5%
Mortgage Type
FHA
Estimated Equity
$283,770
Purchase Details
Closed on
Jan 25, 2012
Sold by
Thompson Renn and Thompson Trudi
Bought by
Thompson Trudi
Purchase Details
Closed on
Sep 22, 2003
Sold by
Craythorne Construction Co Inc
Bought by
Thompson Renn and Thompson Trudi
Home Financials for this Owner
Home Financials are based on the most recent Mortgage that was taken out on this home.
Original Mortgage
$136,500
Interest Rate
6.17%
Mortgage Type
Purchase Money Mortgage
Purchase Details
Closed on
Jun 17, 2003
Sold by
Craythorne Construction Co Inc
Bought by
Craythorne Construction Co Inc and Thompson Renn
Create a Home Valuation Report for This Property
The Home Valuation Report is an in-depth analysis detailing your home's value as well as a comparison with similar homes in the area
Home Values in the Area
Average Home Value in this Area
Purchase History
| Date | Buyer | Sale Price | Title Company |
|---|---|---|---|
| Gregg Kyle | -- | Us Title Company Of | |
| Thompson Trudi | -- | American Preferred | |
| Thompson Renn | -- | Bonneville Title Company Inc | |
| Craythorne Construction Co Inc | -- | -- |
Source: Public Records
Mortgage History
| Date | Status | Borrower | Loan Amount |
|---|---|---|---|
| Open | Gregg Kyle | $368,207 | |
| Previous Owner | Thompson Renn | $136,500 |
Source: Public Records
Tax History
| Year | Tax Paid | Tax Assessment Tax Assessment Total Assessment is a certain percentage of the fair market value that is determined by local assessors to be the total taxable value of land and additions on the property. | Land | Improvement |
|---|---|---|---|---|
| 2025 | $3,163 | $296,451 | $103,516 | $192,935 |
| 2024 | $3,044 | $286,550 | $93,240 | $193,310 |
| 2023 | $2,922 | $506,000 | $113,465 | $392,535 |
| 2022 | $3,273 | $310,200 | $58,265 | $251,935 |
| 2021 | $2,934 | $416,000 | $93,992 | $322,008 |
| 2020 | $2,580 | $361,000 | $78,416 | $282,584 |
| 2019 | $2,341 | $323,000 | $76,241 | $246,759 |
| 2018 | $2,118 | $288,000 | $77,449 | $210,551 |
| 2016 | $1,863 | $133,320 | $34,655 | $98,665 |
| 2015 | $1,895 | $128,480 | $34,655 | $93,825 |
| 2014 | $1,792 | $123,228 | $34,655 | $88,573 |
| 2013 | -- | $122,168 | $39,809 | $82,359 |
Source: Public Records
Map
Nearby Homes
- 3648 W 900 N Unit 207
- 878 N 2600 W
- 3212 W 600 N
- 2283 W 470 N
- 3144 W 1050 N
- 183 N 2925 W
- 2851 W 175 N
- 1251 N 2525 W
- 114 N 2825 W
- 2921 W 1300 N
- 2132 W 800 N
- 704 N 3500 W
- 2792 W 50 S
- 607 N 2000 W
- 1398 N 2475 W
- 1449 N 2475 W
- 2633 N 2080 W Unit 180
- 2623 N 2080 W Unit 178
- 380 S 4300 W Unit 608
- 2619 N 2080 W Unit 177