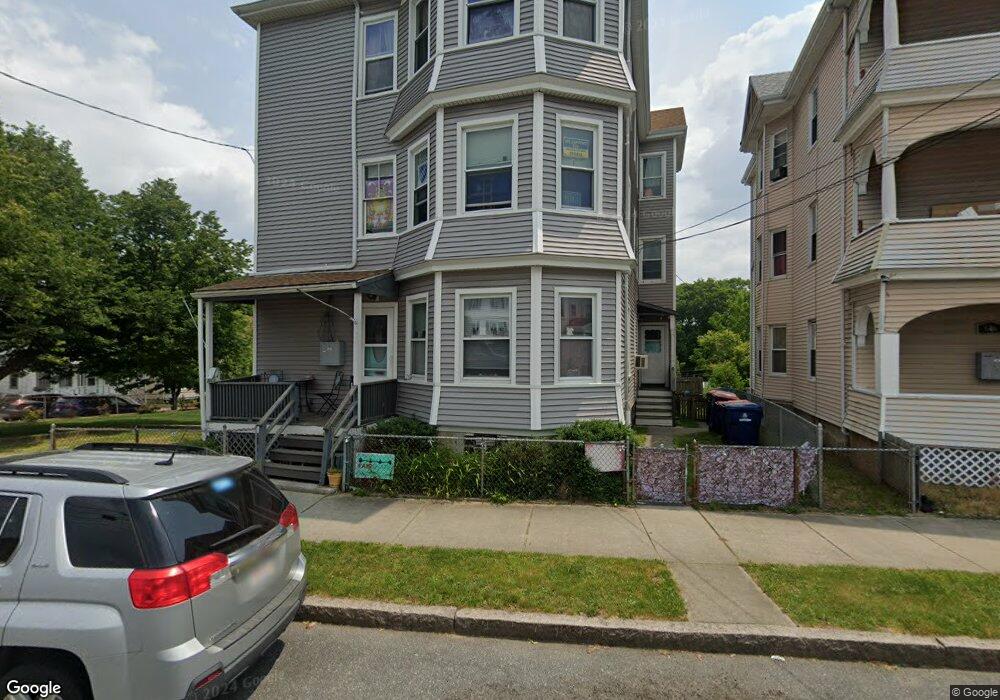
652 Summer St Unit 3 New Bedford, MA 02746
Riverside Park NeighborhoodEstimated Value: $553,000 - $695,000
3
Beds
1
Bath
1,136
Sq Ft
$550/Sq Ft
Est. Value
About This Home
This home is located at 652 Summer St Unit 3, New Bedford, MA 02746 and is currently estimated at $625,075, approximately $550 per square foot. 652 Summer St Unit 3 is a home located in Bristol County with nearby schools including Hayden McFadden Elementary School, Keith Middle School, and New Bedford High School.
Ownership History
Date
Name
Owned For
Owner Type
Purchase Details
Closed on
Dec 29, 2023
Sold by
Cruz Jeannette
Bought by
Gomez Francisco P and Pacheco Biviana P
Current Estimated Value
Home Financials for this Owner
Home Financials are based on the most recent Mortgage that was taken out on this home.
Original Mortgage
$532,000
Outstanding Balance
$523,520
Interest Rate
7.44%
Mortgage Type
Purchase Money Mortgage
Estimated Equity
$101,555
Create a Home Valuation Report for This Property
The Home Valuation Report is an in-depth analysis detailing your home's value as well as a comparison with similar homes in the area
Home Values in the Area
Average Home Value in this Area
Purchase History
| Date | Buyer | Sale Price | Title Company |
|---|---|---|---|
| Gomez Francisco P | $560,000 | None Available | |
| Gomez Francisco P | $560,000 | None Available |
Source: Public Records
Mortgage History
| Date | Status | Borrower | Loan Amount |
|---|---|---|---|
| Open | Gomez Francisco P | $532,000 | |
| Closed | Gomez Francisco P | $532,000 |
Source: Public Records
Tax History Compared to Growth
Tax History
| Year | Tax Paid | Tax Assessment Tax Assessment Total Assessment is a certain percentage of the fair market value that is determined by local assessors to be the total taxable value of land and additions on the property. | Land | Improvement |
|---|---|---|---|---|
| 2025 | $6,470 | $572,100 | $100,000 | $472,100 |
| 2024 | $5,086 | $423,800 | $85,400 | $338,400 |
| 2023 | $4,546 | $318,100 | $71,600 | $246,500 |
| 2022 | $4,127 | $265,600 | $65,400 | $200,200 |
| 2021 | $4,032 | $258,600 | $65,400 | $193,200 |
| 2020 | $4,016 | $248,500 | $65,400 | $183,100 |
| 2019 | $3,472 | $210,800 | $65,400 | $145,400 |
| 2018 | $3,308 | $198,900 | $65,400 | $133,500 |
| 2017 | $3,066 | $183,700 | $65,400 | $118,300 |
| 2016 | $2,940 | $178,300 | $65,400 | $112,900 |
| 2015 | $2,743 | $174,400 | $65,400 | $109,000 |
| 2014 | $2,644 | $174,400 | $65,400 | $109,000 |
Source: Public Records
Map
Nearby Homes