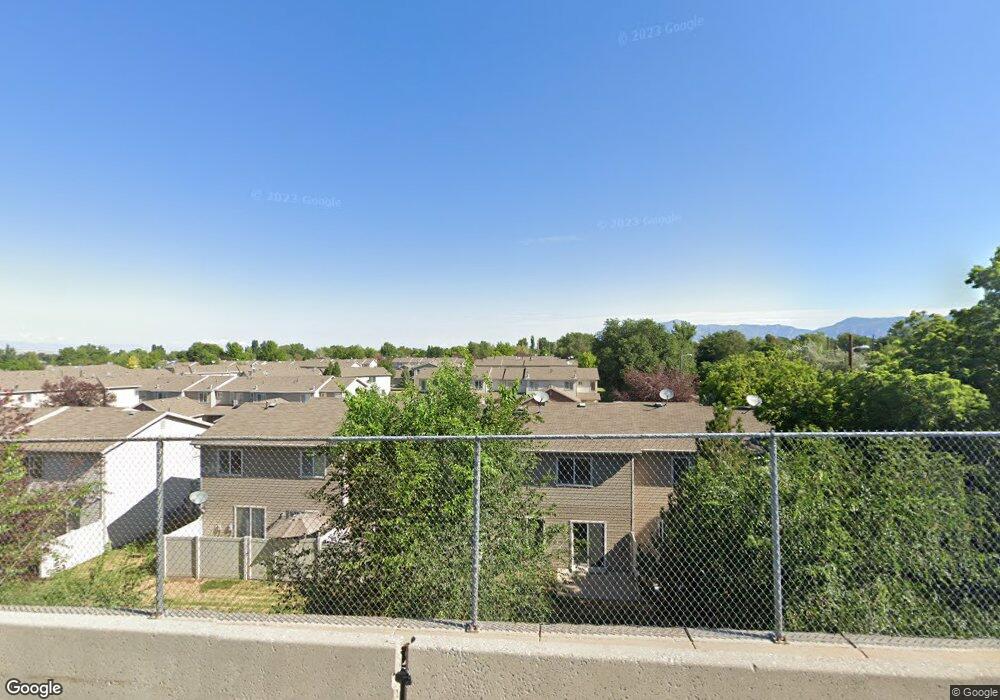
652 W 800 N Unit 127 Clearfield, UT 84015
Estimated Value: $323,000 - $342,000
2
Beds
2
Baths
1,260
Sq Ft
$261/Sq Ft
Est. Value
About This Home
This home is located at 652 W 800 N Unit 127, Clearfield, UT 84015 and is currently estimated at $329,313, approximately $261 per square foot. 652 W 800 N Unit 127 is a home located in Davis County with nearby schools including Clinton Elementary School, Sunset Junior High School, and Clearfield High School.
Ownership History
Date
Name
Owned For
Owner Type
Purchase Details
Closed on
Dec 14, 2006
Sold by
Morris Nathan K and Morris Julie M
Bought by
Yarborough Damon S
Current Estimated Value
Purchase Details
Closed on
Sep 21, 2005
Sold by
Nilson & Co Inc
Bought by
Morris Nathan K and Morris Julie M
Home Financials for this Owner
Home Financials are based on the most recent Mortgage that was taken out on this home.
Original Mortgage
$85,776
Interest Rate
5.81%
Mortgage Type
Fannie Mae Freddie Mac
Create a Home Valuation Report for This Property
The Home Valuation Report is an in-depth analysis detailing your home's value as well as a comparison with similar homes in the area
Home Values in the Area
Average Home Value in this Area
Purchase History
| Date | Buyer | Sale Price | Title Company |
|---|---|---|---|
| Yarborough Damon S | -- | First American Title | |
| Morris Nathan K | -- | Bonneville Title Company |
Source: Public Records
Mortgage History
| Date | Status | Borrower | Loan Amount |
|---|---|---|---|
| Previous Owner | Morris Nathan K | $85,776 |
Source: Public Records
Tax History Compared to Growth
Tax History
| Year | Tax Paid | Tax Assessment Tax Assessment Total Assessment is a certain percentage of the fair market value that is determined by local assessors to be the total taxable value of land and additions on the property. | Land | Improvement |
|---|---|---|---|---|
| 2025 | $1,636 | $157,300 | $53,900 | $103,400 |
| 2024 | $1,588 | $153,450 | $41,250 | $112,200 |
| 2023 | $1,532 | $150,700 | $41,800 | $108,900 |
| 2022 | $1,534 | $276,000 | $63,000 | $213,000 |
| 2021 | $1,342 | $197,000 | $49,000 | $148,000 |
| 2020 | $1,177 | $171,000 | $44,400 | $126,600 |
| 2019 | $1,149 | $163,000 | $42,000 | $121,000 |
| 2018 | $1,040 | $145,000 | $37,000 | $108,000 |
| 2016 | $930 | $66,935 | $14,850 | $52,085 |
| 2015 | $864 | $59,125 | $14,850 | $44,275 |
| 2014 | $838 | $58,291 | $14,850 | $43,441 |
| 2013 | -- | $68,690 | $14,850 | $53,840 |
Source: Public Records
Map
Nearby Homes
- 652 W 800 N Unit 140
- 652 W 800 N Unit 139
- 652 W 800 N Unit 138
- 652 W 800 N Unit 137
- 652 W 800 N Unit 136
- 652 W 800 N Unit 135
- 652 W 800 N Unit 134
- 652 W 800 N Unit 133
- 652 W 800 N Unit 132
- 652 W 800 N Unit 131
- 652 W 800 N Unit 130
- 652 W 800 N Unit 129
- 652 W 800 N Unit 128
- 652 W 800 N Unit 126
- 652 W 800 N Unit 125
- 652 W 800 N Unit 124
- 652 W 800 N Unit 123
- 652 W 800 N Unit 122
- 652 W 800 N Unit 121
- 652 W 800 N Unit 120