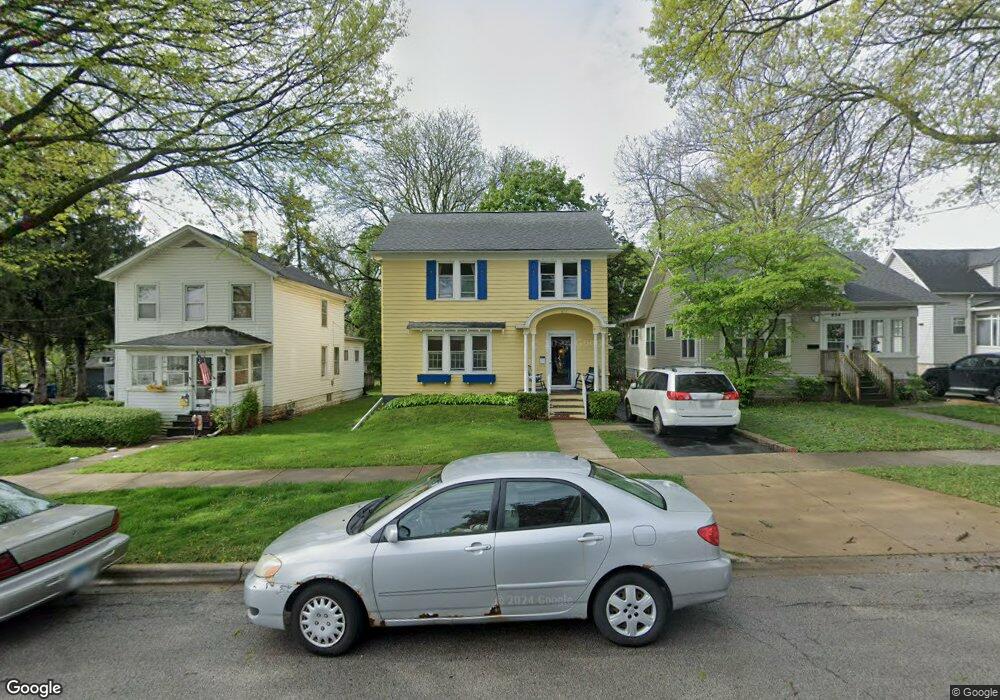
652 W New York St Aurora, IL 60506
Blackhawk NeighborhoodEstimated Value: $230,000 - $256,000
3
Beds
1
Bath
1,456
Sq Ft
$170/Sq Ft
Est. Value
About This Home
This home is located at 652 W New York St, Aurora, IL 60506 and is currently estimated at $248,204, approximately $170 per square foot. 652 W New York St is a home located in Kane County with nearby schools including Greenman Elementary School, Jefferson Middle School, and West Aurora High School.
Ownership History
Date
Name
Owned For
Owner Type
Purchase Details
Closed on
Sep 26, 2006
Sold by
Roit Rose Marie and Reising Thomas A
Bought by
Underhill Nathanael D and Underhill Sarah J
Current Estimated Value
Home Financials for this Owner
Home Financials are based on the most recent Mortgage that was taken out on this home.
Original Mortgage
$118,400
Outstanding Balance
$70,076
Interest Rate
6.5%
Mortgage Type
Purchase Money Mortgage
Estimated Equity
$178,128
Purchase Details
Closed on
Mar 21, 2006
Sold by
Wilger Gloria A
Bought by
Wilger Bernard F and Wilger Gloria A
Purchase Details
Closed on
Sep 8, 2004
Sold by
Reising Thomas A
Bought by
Reising Thomas A and Hartley Reising Sherry
Purchase Details
Closed on
Jun 14, 2004
Sold by
Reising Thomas A
Bought by
Wilger Gloria A
Purchase Details
Closed on
Jan 20, 2003
Sold by
Reising William S
Bought by
Reising William S and William S Reising Revocable Living Trust
Create a Home Valuation Report for This Property
The Home Valuation Report is an in-depth analysis detailing your home's value as well as a comparison with similar homes in the area
Home Values in the Area
Average Home Value in this Area
Purchase History
| Date | Buyer | Sale Price | Title Company |
|---|---|---|---|
| Underhill Nathanael D | $148,000 | First American Title | |
| Wilger Bernard F | -- | None Available | |
| Reising Thomas A | -- | -- | |
| Wilger Gloria A | -- | -- | |
| Reising William S | -- | -- |
Source: Public Records
Mortgage History
| Date | Status | Borrower | Loan Amount |
|---|---|---|---|
| Open | Underhill Nathanael D | $118,400 |
Source: Public Records
Tax History Compared to Growth
Tax History
| Year | Tax Paid | Tax Assessment Tax Assessment Total Assessment is a certain percentage of the fair market value that is determined by local assessors to be the total taxable value of land and additions on the property. | Land | Improvement |
|---|---|---|---|---|
| 2024 | $4,522 | $65,111 | $10,738 | $54,373 |
| 2023 | $4,298 | $58,176 | $9,594 | $48,582 |
| 2022 | $4,168 | $53,081 | $8,754 | $44,327 |
| 2021 | $3,967 | $49,419 | $8,150 | $41,269 |
| 2020 | $3,736 | $45,903 | $7,570 | $38,333 |
| 2019 | $3,572 | $42,531 | $7,014 | $35,517 |
| 2018 | $3,430 | $40,360 | $6,488 | $33,872 |
| 2017 | $2,956 | $34,723 | $5,978 | $28,745 |
| 2016 | $2,545 | $29,957 | $5,124 | $24,833 |
| 2015 | -- | $30,948 | $4,406 | $26,542 |
| 2014 | -- | $28,631 | $4,049 | $24,582 |
| 2013 | -- | $32,761 | $3,869 | $28,892 |
Source: Public Records
Map
Nearby Homes
- 710 W Downer Place
- 932 W New York St
- 541 Charles St
- 809 W Park Ave
- 850 W Galena Blvd
- 518 W Park Ave
- 930 W New York St Unit 932
- 931 W Downer Place
- 450 W Downer Place Unit 4C
- 943 Charles St
- 175 S Harrison Ave
- 441 N View St
- 415 Blackhawk St
- 602 N May St
- 526 N View St
- 616 Morton Ave
- 519 N View St
- 256 W Downer Place
- 222 Grand Ave
- 237 Ingleside Ave
- 648 W New York St
- 654 W New York St
- 644 W New York St
- 660 W New York St
- 642 W New York St
- 638 W New York St
- 19 N Russell Ave
- 655 W Galena Blvd
- 651 W Galena Blvd
- 657 W Galena Blvd
- 13 N Russell Ave
- 647 W Galena Blvd
- 663 W Galena Blvd
- 11 N Russell Ave
- 636 W New York St
- 645 W Galena Blvd
- 651 W New York St
- 653 W New York St
- 643 W Galena Blvd
- 657 W New York St