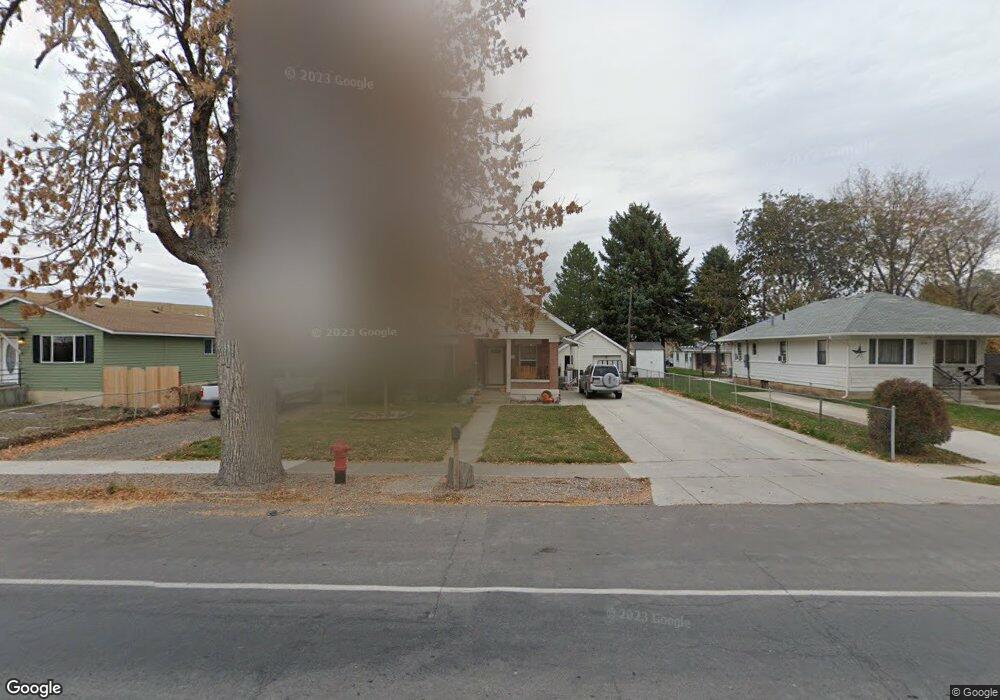
652 W Utah Ave Payson, UT 84651
Estimated Value: $427,000 - $464,000
5
Beds
2
Baths
1,819
Sq Ft
$245/Sq Ft
Est. Value
About This Home
This home is located at 652 W Utah Ave, Payson, UT 84651 and is currently estimated at $445,789, approximately $245 per square foot. 652 W Utah Ave is a home located in Utah County with nearby schools including Taylor Elementary School, Salem Junior High School, and Valley View Middle School.
Ownership History
Date
Name
Owned For
Owner Type
Purchase Details
Closed on
Mar 10, 2024
Sold by
Mirco Ii Llc
Bought by
Harper Blaine Taylor and Harper Miriam
Current Estimated Value
Purchase Details
Closed on
Dec 29, 2016
Sold by
Nielson Scott O and Nielson Julie A
Bought by
Critchlow Chad and Critchlow Rebecca
Home Financials for this Owner
Home Financials are based on the most recent Mortgage that was taken out on this home.
Original Mortgage
$206,342
Interest Rate
4.62%
Mortgage Type
FHA
Create a Home Valuation Report for This Property
The Home Valuation Report is an in-depth analysis detailing your home's value as well as a comparison with similar homes in the area
Home Values in the Area
Average Home Value in this Area
Purchase History
| Date | Buyer | Sale Price | Title Company |
|---|---|---|---|
| Harper Blaine Taylor | -- | None Listed On Document | |
| Critchlow Chad | -- | Pro Title And Escrow Inc |
Source: Public Records
Mortgage History
| Date | Status | Borrower | Loan Amount |
|---|---|---|---|
| Previous Owner | Critchlow Chad | $206,342 |
Source: Public Records
Tax History
| Year | Tax Paid | Tax Assessment Tax Assessment Total Assessment is a certain percentage of the fair market value that is determined by local assessors to be the total taxable value of land and additions on the property. | Land | Improvement |
|---|---|---|---|---|
| 2025 | $2,025 | $213,840 | -- | -- |
| 2024 | $2,025 | $206,085 | $0 | $0 |
| 2023 | $2,009 | $204,985 | $0 | $0 |
| 2022 | $1,856 | $186,285 | $0 | $0 |
| 2021 | $1,575 | $253,600 | $90,200 | $163,400 |
| 2020 | $1,460 | $230,000 | $78,400 | $151,600 |
| 2019 | $1,253 | $202,300 | $70,500 | $131,800 |
| 2018 | $1,119 | $174,200 | $59,600 | $114,600 |
| 2017 | $1,041 | $87,175 | $0 | $0 |
| 2016 | $1,012 | $84,150 | $0 | $0 |
| 2015 | $904 | $74,690 | $0 | $0 |
| 2014 | $836 | $69,575 | $0 | $0 |
Source: Public Records
Map
Nearby Homes
- 588 W Utah Ave
- 221 S Majestic Meadows Dr
- 845 W 400 N
- 227 S Majestic Meadows Dr
- 742 W 400 S
- 116 S 300 W
- 128 S 300 W
- 451 N 500 W
- 451 N 500 W Unit 39
- 195 W 300 N
- 533 S 700 W
- 420 N 150 W
- 626 S 800 W Unit 32
- 383 W 625 N Unit A-D
- 384 W 650 N Unit A-D
- 118 E 100 N
- 116 E 100 S
- 361 W 625 N Unit A-D
- 1836 S 100 E
- 9672 S 3550 W
Your Personal Tour Guide
Ask me questions while you tour the home.