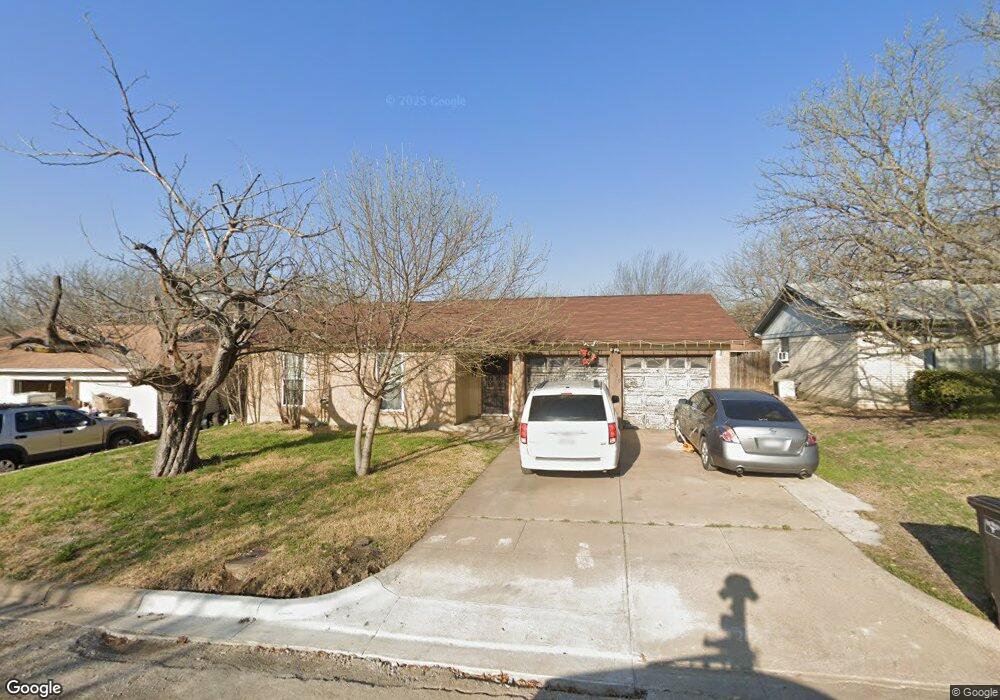
6520 Cervantes Ave Fort Worth, TX 76133
Wedgwood NeighborhoodEstimated Value: $221,142 - $273,000
3
Beds
2
Baths
1,183
Sq Ft
$200/Sq Ft
Est. Value
About This Home
This home is located at 6520 Cervantes Ave, Fort Worth, TX 76133 and is currently estimated at $237,036, approximately $200 per square foot. 6520 Cervantes Ave is a home located in Tarrant County with nearby schools including Woodway Elementary School, Wedgwood Middle School, and Wedgwood Sixth Grade Center.
Ownership History
Date
Name
Owned For
Owner Type
Purchase Details
Closed on
Nov 19, 2020
Sold by
Samano Jose and Samano Isabel
Bought by
Gutierrez Aristeo Garcia
Current Estimated Value
Home Financials for this Owner
Home Financials are based on the most recent Mortgage that was taken out on this home.
Original Mortgage
$148,500
Outstanding Balance
$107,263
Interest Rate
2.8%
Mortgage Type
New Conventional
Estimated Equity
$129,773
Purchase Details
Closed on
Aug 29, 2017
Sold by
Hudson William
Bought by
Samano Jose and Samano Isabel
Purchase Details
Closed on
Apr 7, 2007
Sold by
Hudson Karla
Bought by
Hudson William
Purchase Details
Closed on
Jan 18, 1995
Sold by
Thomson Josephine Elaine Barber Burleson
Bought by
Landwermeyer Karla J
Home Financials for this Owner
Home Financials are based on the most recent Mortgage that was taken out on this home.
Original Mortgage
$39,600
Interest Rate
9.09%
Create a Home Valuation Report for This Property
The Home Valuation Report is an in-depth analysis detailing your home's value as well as a comparison with similar homes in the area
Home Values in the Area
Average Home Value in this Area
Purchase History
| Date | Buyer | Sale Price | Title Company |
|---|---|---|---|
| Gutierrez Aristeo Garcia | -- | Mcknight Title | |
| Samano Jose | -- | None Available | |
| Hudson William | -- | None Available | |
| Landwermeyer Karla J | -- | Commonwealth Land Title |
Source: Public Records
Mortgage History
| Date | Status | Borrower | Loan Amount |
|---|---|---|---|
| Open | Gutierrez Aristeo Garcia | $148,500 | |
| Previous Owner | Landwermeyer Karla J | $39,600 | |
| Closed | Landwermeyer Karla J | $3,371 |
Source: Public Records
Tax History Compared to Growth
Tax History
| Year | Tax Paid | Tax Assessment Tax Assessment Total Assessment is a certain percentage of the fair market value that is determined by local assessors to be the total taxable value of land and additions on the property. | Land | Improvement |
|---|---|---|---|---|
| 2025 | $4,553 | $202,897 | $30,000 | $172,897 |
| 2024 | $4,553 | $202,897 | $30,000 | $172,897 |
| 2023 | $4,555 | $201,280 | $30,000 | $171,280 |
| 2022 | $4,747 | $182,598 | $30,000 | $152,598 |
| 2021 | $4,119 | $150,158 | $30,000 | $120,158 |
| 2020 | $3,741 | $149,354 | $30,000 | $119,354 |
| 2019 | $3,534 | $138,890 | $30,000 | $108,890 |
| 2018 | $2,692 | $116,799 | $20,000 | $96,799 |
| 2017 | $2,389 | $99,542 | $20,000 | $79,542 |
| 2016 | $2,172 | $87,114 | $16,000 | $71,114 |
| 2015 | $1,661 | $69,700 | $11,500 | $58,200 |
| 2014 | $1,661 | $69,700 | $11,500 | $58,200 |
Source: Public Records
Map
Nearby Homes
- 3809 Misty Meadow Dr
- 3753 Misty Meadow Dr
- 3817 Misty Meadow Dr
- 4021 Aragon Dr
- 4032 Aragon Dr
- 6709 Santiago Ave
- 4021 Toledo Ave
- 3901 Willow Way Rd
- 6905 W Cleburne Rd
- 6817 W Cleburne Rd
- 3913 Misty Meadow Dr
- 7000 Santa Rita Ct
- 6404 San Juan Ave
- 7008 Natchez Ct
- 6808 Westglen Dr
- 3800 Wedgworth Rd S
- 6809 Welch Ave
- 3836 Wedgworth Rd S
- 3254 Amber Ct
- 4225 Capilla St
- 6600 Cervantes Ave
- 6516 Cervantes Ave
- 6604 Cervantes Ave
- 6512 Cervantes Ave
- 6521 Andora Ave
- 6517 Andora Ave
- 6601 Andora Ave
- 6605 Andora Ave
- 6521 Cervantes Ave
- 6513 Andora Ave
- 6608 Cervantes Ave
- 6517 Cervantes Ave
- 6508 Cervantes Ave
- 6601 Cervantes Ave
- 6513 Cervantes Ave
- 6609 Andora Ave
- 6605 Cervantes Ave
- 6509 Andora Ave
- 6612 Cervantes Ave
- 6509 Cervantes Ave