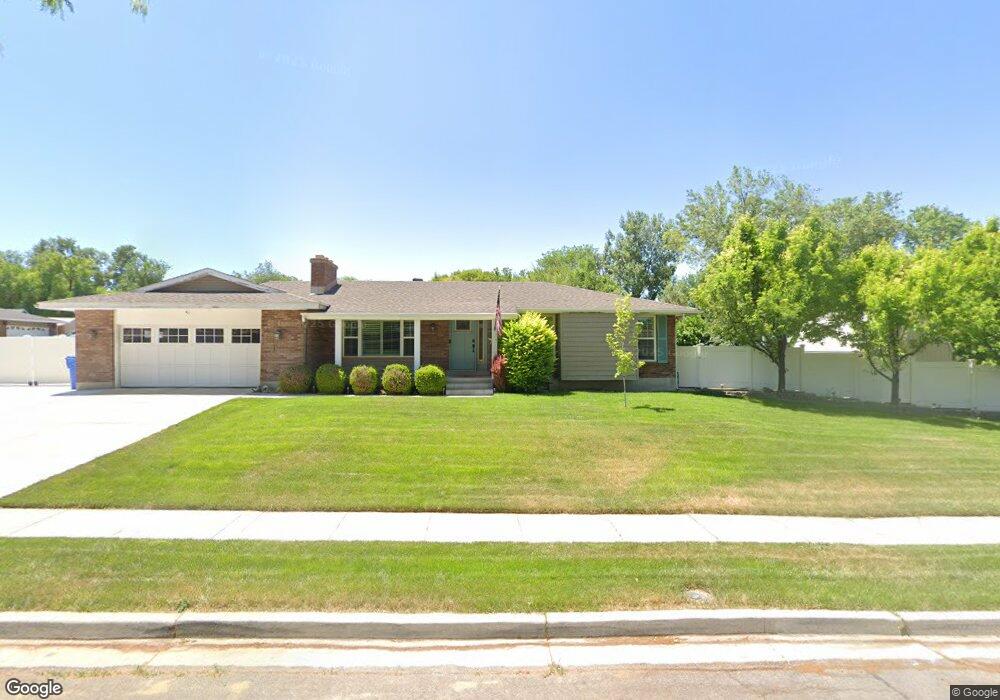
6520 S Bluemont Dr Salt Lake City, UT 84123
Estimated Value: $647,000 - $694,000
5
Beds
3
Baths
2,986
Sq Ft
$226/Sq Ft
Est. Value
About This Home
This home is located at 6520 S Bluemont Dr, Salt Lake City, UT 84123 and is currently estimated at $674,949, approximately $226 per square foot. 6520 S Bluemont Dr is a home located in Salt Lake County with nearby schools including Calvin S Smith Elementary School, Bennion Junior High School, and Taylorsville High School.
Ownership History
Date
Name
Owned For
Owner Type
Purchase Details
Closed on
Dec 15, 2021
Sold by
Matt Blalock
Bought by
Blalock Matt and Wilkes Valerie
Current Estimated Value
Home Financials for this Owner
Home Financials are based on the most recent Mortgage that was taken out on this home.
Original Mortgage
$465,000
Outstanding Balance
$427,678
Interest Rate
3.11%
Mortgage Type
New Conventional
Estimated Equity
$247,271
Purchase Details
Closed on
Dec 14, 2021
Sold by
Dale Humphreys Michael
Bought by
Blalock Matt
Home Financials for this Owner
Home Financials are based on the most recent Mortgage that was taken out on this home.
Original Mortgage
$465,000
Outstanding Balance
$427,678
Interest Rate
3.11%
Mortgage Type
New Conventional
Estimated Equity
$247,271
Purchase Details
Closed on
Dec 1, 2020
Sold by
Humphreys Michael Dale and Humphreys Sharyn E
Bought by
Humphreys Michael Dale
Create a Home Valuation Report for This Property
The Home Valuation Report is an in-depth analysis detailing your home's value as well as a comparison with similar homes in the area
Home Values in the Area
Average Home Value in this Area
Purchase History
| Date | Buyer | Sale Price | Title Company |
|---|---|---|---|
| Blalock Matt | -- | First American Title | |
| Blalock Matt | -- | Vanguard Title | |
| Blalock Matt | -- | Vanguard Title | |
| Humphreys Michael Dale | -- | Integrated Title Ins Svcs |
Source: Public Records
Mortgage History
| Date | Status | Borrower | Loan Amount |
|---|---|---|---|
| Open | Blalock Matt | $465,000 | |
| Closed | Blalock Matt | $465,000 | |
| Closed | Blalock Matt | $465,000 |
Source: Public Records
Tax History Compared to Growth
Tax History
| Year | Tax Paid | Tax Assessment Tax Assessment Total Assessment is a certain percentage of the fair market value that is determined by local assessors to be the total taxable value of land and additions on the property. | Land | Improvement |
|---|---|---|---|---|
| 2025 | $3,948 | $669,100 | $182,100 | $487,000 |
| 2024 | $3,948 | $647,500 | $176,400 | $471,100 |
| 2023 | $3,855 | $610,000 | $164,800 | $445,200 |
| 2022 | $3,831 | $621,700 | $161,600 | $460,100 |
| 2021 | $3,075 | $434,600 | $124,300 | $310,300 |
| 2020 | $3,074 | $386,300 | $114,400 | $271,900 |
| 2019 | $3,365 | $382,100 | $114,400 | $267,700 |
| 2018 | $2,930 | $337,600 | $110,600 | $227,000 |
| 2017 | $2,490 | $316,600 | $110,600 | $206,000 |
| 2016 | $2,352 | $298,300 | $110,600 | $187,700 |
| 2015 | $2,736 | $289,400 | $112,800 | $176,600 |
| 2014 | $2,251 | $273,200 | $107,500 | $165,700 |
Source: Public Records
Map
Nearby Homes
- 1501 W Bluemont Dr
- 1481 W Bluemont Dr
- 1429 Connie Way
- 6660 S Ryker Vista Ln
- 1506 W 6235 S
- 6189 S Elderberry Ln
- 6683 Alice Susanna Ln
- 1471 W 6170 S
- 6773 S 1300 W
- 6738 Balfour Ln W
- 6687 Bonham Ln
- 6891 S Columbia Dr
- 1212 W Willow Run Dr
- 1297 Glencoe Dr
- 2126 W Happiness Dr
- 1193 W Dun Robin Ct
- 2137 W 6200 S
- 1179 W Dun Robin Ct
- 1612 W Beamon St
- 2333 W Ledgewood Dr
- 6520 Bluemont Dr
- 1568 Bluemont Cir
- 1553 Shenandoah Cir
- 1551 Bluemont Cir
- 1569 Shenandoah Cir
- 1567 Bluemont Cir
- 6523 Bluemont Dr
- 6523 S Bluemont Dr
- 1567 W Bluemont Cir
- 1582 W Bluemont Cir
- 1582 Bluemont Cir
- 6507 Bluemont Dr
- 6507 S Bluemont Dr
- 1537 Bluemont Cir
- 1537 W Bluemont Cir
- 6533 Bluemont Dr
- 1585 Shenandoah Cir
- 1583 W Bluemont Cir
- 1583 Bluemont Cir
- 6491 Bluemont Dr