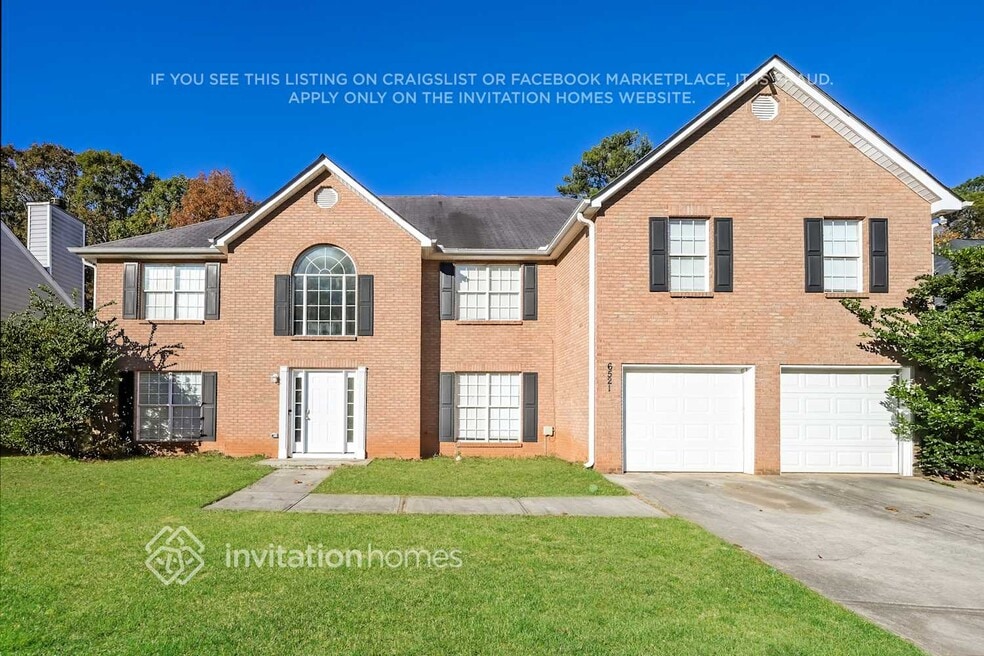
6521 Carriage Ln Stone Mountain, GA 30087
About This Home
Lease this home and get more from Invitation Homes professional property management. This home comes fully loaded with quality amenities, must-have services, high-end tech and ProCare® professional maintenance. Your estimated total monthly payment is $2589.90. That covers your base rent, $2445.00 + our required services designed to make your life easier: Air Filter Delivery Fee ($9.95), Internet & Media ($85), Smart Home with video doorbell ($40), and Utility Billing Service Fee ($9.95). Base rent varies based on selected lease term.
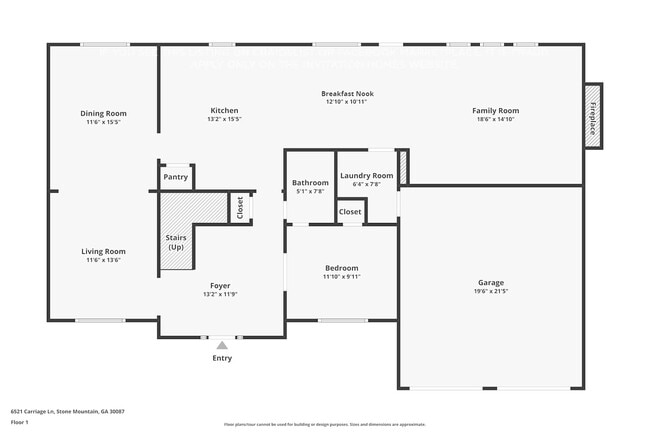
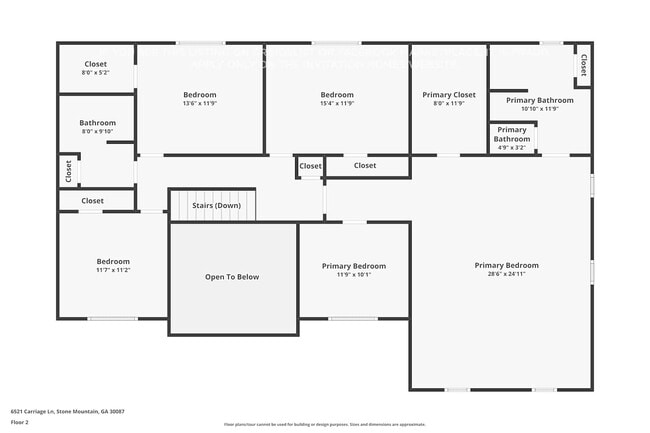
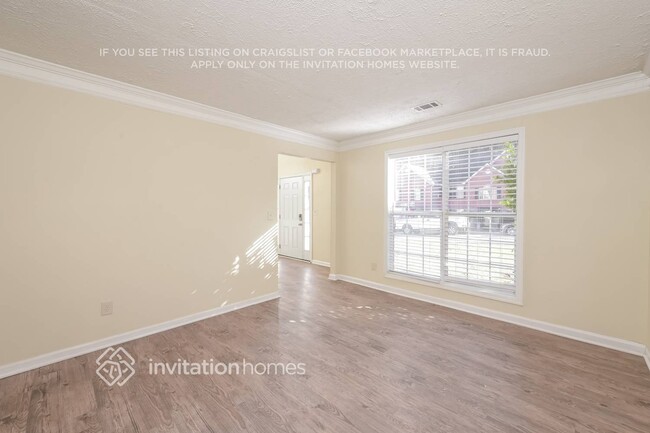
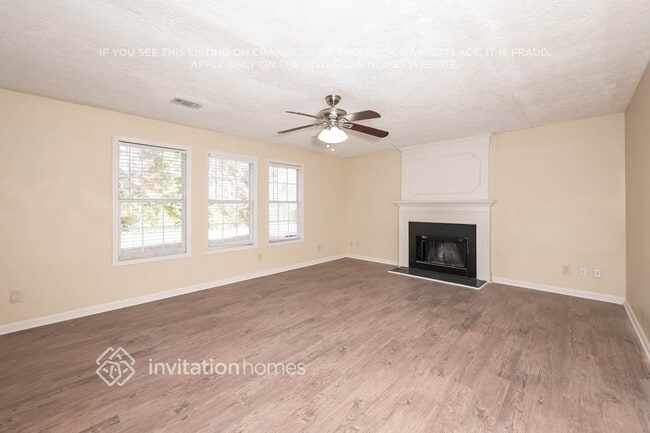
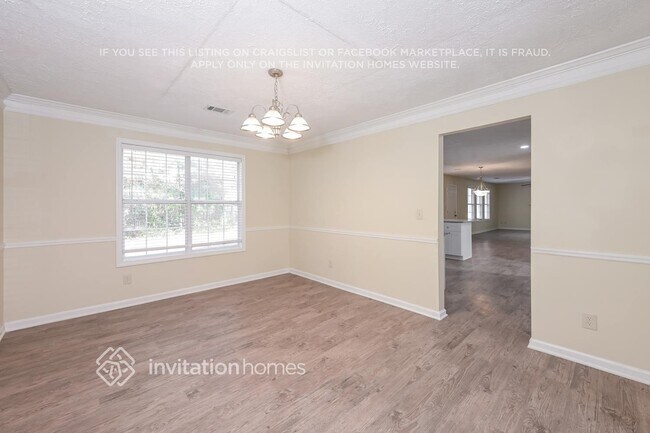
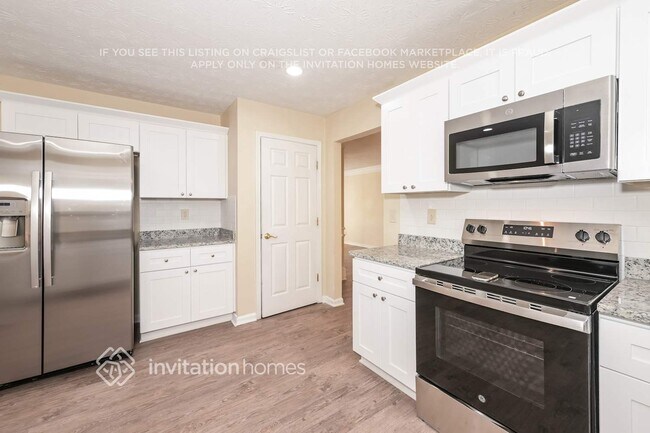
Loving where you live is easy when you have a house like this. Tailor the living space to support the things you value. Bring your unique flair to this spacious floor plan made ready to accommodate your lifestyle. Quality is the first word that jumps to mind when you walk through this house's lovely entryway and set foot on the stunning luxury vinyl plank flooring. Enjoy preparing meals in a finished kitchen. Stainless steel appliances, premium cabinetry and granite countertops gives you a worry-free cooking space worthy of you. A backyard perfect for any occasion awaits you in this beautiful home. There's a patio where you can take advantage of outdoor meals and offers plenty of space to set up your preferred furniture so you can lean back, relax and let the day's stress fade away. Apply online today!
At Invitation Homes, we offer pet-friendly, yard-having homes for lease with Smart Home technology in awesome neighborhoods across the country. Live in a great house without the headache and long-term commitment of owning. Discover your dream home with Invitation Homes.
To make your leasing lifestyle as hassle-free as possible, every Invitation Homes lease requires a subscription to our Lease Easy bundle. You’ll enjoy more convenience and control with standard services that may include air filter delivery, utility management, and Smart Home with video doorbell. Want to take easy to the next level? Lawn care and pest control are also available.
Home Features and Amenities: Air Conditioning, Fireplace, Garage, Granite Countertops, Long Lease Terms, Luxury Vinyl Plank, Patio, Pet Friendly, Recessed Lighting, Smart Home, Stainless Steel Appliances, W/D Hookups, and professionally managed by Invitation Homes.
Invitation Homes is an equal housing lessor under the FHA. Applicable local, state and federal laws may apply. Additional terms and conditions apply. This listing is not an offer to rent. You must submit additional information including an application to rent and an application fee. All leasing information is believed to be accurate, but changes may have occurred since photographs were taken and square footage is estimated. Furthermore, prices and dates may change without notice. Every approved applicant must confirm the status of pet(s) in their home through and pay applicable pet registration fees prior to the execution of the final lease agreement. See InvitationHomes website for more information.
Beware of scams: Employees of Invitation Homes will never ask you for your username and password. Invitation Homes does not advertise on Craigslist, Social Serve, etc. We own our homes; there are no private owners. All funds to lease with Invitation Homes are paid directly through our website, never through wire transfer or payment app like Zelle, Pay Pal, or Cash App.
For more info, please submit an inquiry for this home. Applications are subject to our qualification requirements. Additional terms and conditions apply. CONSENT TO CALLS & TEXT MESSAGING: By entering your contact information, you expressly consent to receive emails, calls, and text messages from Invitation Homes including by autodialer, prerecorded or artificial voice and including marketing communications. Msg & Data rates may apply. You also agree to our Terms of Use and our Privacy Policy.

Map
- 711 Ashley Ln
- 1001 Pine Ridge Dr
- 785 Pine Ridge Bend
- 6643 Red Oak Way
- 6675 Princeton Park Ct
- Hazel Plan at Summertree
- Elder Plan at Summertree
- Cedar Plan at Summertree
- Fairview Plan at Summertree
- 861 Southland Pass
- 6390 Alford Cir
- 6426 Alford Cir
- 676 Bralorne Dr
- 1276 Huntington Place Cir
- 648 Bralorne Dr
- 1077 Crooked Creek Rd
- 1174 Falkirk Ln
- 1124 Shady Creek Dr
- 1148 Falkirk Ln
- 980 Brigade St
- 6650 Etterlee Dr
- 6627 Shapiro Ct
- 6525 Alford Way
- 6663 Princeton Park Ct
- 6481 Alford Way
- 1008 Carriage Trace Cir
- 6544 Huntington Ct
- 6455 Alford Cir
- 1128 Southland Bluff
- 6474 Rebecca Way
- 6288 Lake Valley Point
- 978 Valley Rock Dr
- 1098 Deshon Trail
- 1010 Valley Rock Dr
- 6514 Woodthrush Way
- 888 Timbercrest Ct Unit 2
- 893 Timbervale Ln
- 1198 Oak Knoll Ct
- 1188 Wildwood Trace Unit B