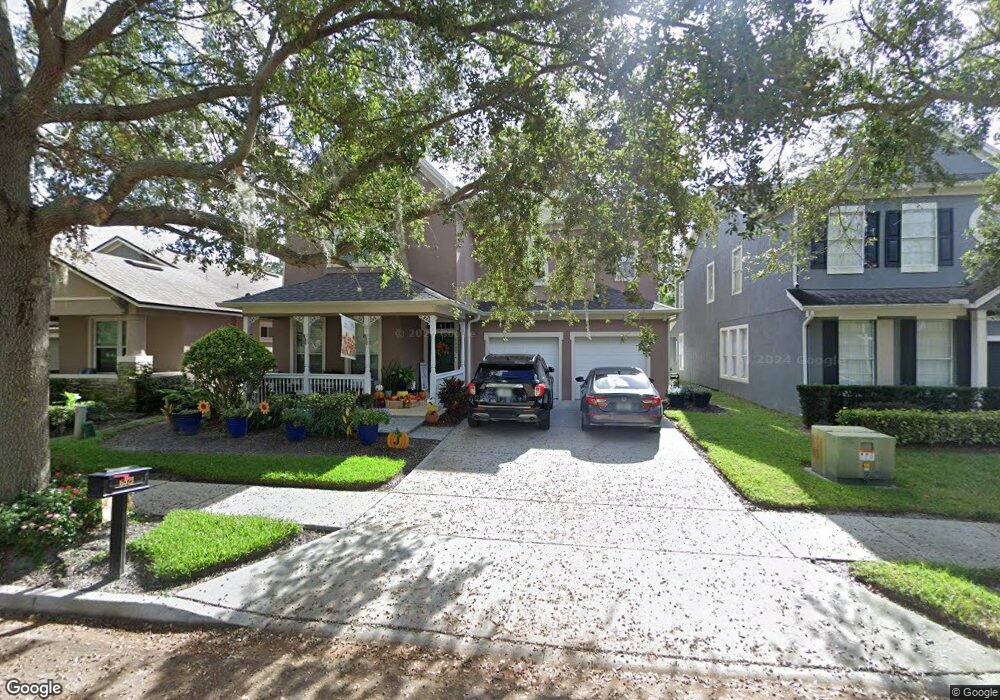
6521 Chagford Ln Windermere, FL 34786
Estimated Value: $565,000 - $725,000
4
Beds
3
Baths
3,418
Sq Ft
$182/Sq Ft
Est. Value
About This Home
This home is located at 6521 Chagford Ln, Windermere, FL 34786 and is currently estimated at $621,122, approximately $181 per square foot. 6521 Chagford Ln is a home located in Orange County with nearby schools including Sunset Park Elementary School, Horizon West Middle School, and Windermere High School.
Ownership History
Date
Name
Owned For
Owner Type
Purchase Details
Closed on
Dec 31, 2009
Sold by
Glinkin Alexey M
Bought by
Zighighi Adil
Current Estimated Value
Home Financials for this Owner
Home Financials are based on the most recent Mortgage that was taken out on this home.
Original Mortgage
$147,000
Interest Rate
4.32%
Mortgage Type
New Conventional
Purchase Details
Closed on
Dec 26, 2006
Sold by
Battillo Chihming and Wang Xike
Bought by
Glinkin Alexey M
Home Financials for this Owner
Home Financials are based on the most recent Mortgage that was taken out on this home.
Original Mortgage
$474,050
Interest Rate
1.87%
Mortgage Type
Negative Amortization
Purchase Details
Closed on
May 27, 2005
Sold by
Ashton Orlando Residential Llc
Bought by
Battillo Chihming and Wang Zike
Create a Home Valuation Report for This Property
The Home Valuation Report is an in-depth analysis detailing your home's value as well as a comparison with similar homes in the area
Home Values in the Area
Average Home Value in this Area
Purchase History
| Date | Buyer | Sale Price | Title Company |
|---|---|---|---|
| Zighighi Adil | $196,000 | Sunbelt Title Agency | |
| Glinkin Alexey M | $499,000 | Emerald Seas Title Llc | |
| Battillo Chihming | $302,100 | -- |
Source: Public Records
Mortgage History
| Date | Status | Borrower | Loan Amount |
|---|---|---|---|
| Previous Owner | Zighighi Adil | $147,000 | |
| Previous Owner | Glinkin Alexey M | $474,050 |
Source: Public Records
Tax History Compared to Growth
Tax History
| Year | Tax Paid | Tax Assessment Tax Assessment Total Assessment is a certain percentage of the fair market value that is determined by local assessors to be the total taxable value of land and additions on the property. | Land | Improvement |
|---|---|---|---|---|
| 2025 | $8,077 | $463,659 | -- | -- |
| 2024 | $7,119 | $463,659 | -- | -- |
| 2023 | $7,119 | $470,174 | $110,000 | $360,174 |
| 2022 | $6,147 | $375,728 | $100,000 | $275,728 |
| 2021 | $5,588 | $316,685 | $75,000 | $241,685 |
| 2020 | $5,011 | $291,191 | $70,000 | $221,191 |
| 2019 | $5,310 | $292,908 | $70,000 | $222,908 |
| 2018 | $3,903 | $244,127 | $0 | $0 |
| 2017 | $3,835 | $263,283 | $52,000 | $211,283 |
| 2016 | $3,784 | $256,841 | $52,000 | $204,841 |
| 2015 | $3,846 | $244,070 | $52,000 | $192,070 |
| 2014 | $3,929 | $230,714 | $50,000 | $180,714 |
Source: Public Records
Map
Nearby Homes
- 6905 Nobleton Dr
- 12663 Hawkstone Dr
- 12654 Cragside Ln
- 7011 Nobleton Dr
- 12880 Holdenbury Ln
- 6891 Northwich Dr
- 6947 Cucamelon Ct
- 12925 Holdenbury Ln
- 6965 Tettenhall Ln
- 6926 Cucamelon Ct
- 6957 Northwich Dr
- 12980 Holdenbury Ln
- 6832 Thornhill Cir
- 6712 Thornhill Cir
- 12530 Climbing Vine Ct
- 7418 Bentonshire Ave
- 11450 Arborside Bend Way
- 11438 Arborside Bend Way
- 6615 Helmsley Cir
- 7462 Bentonshire Ave
- 6515 Chagford Ln
- 6527 Chagford Ln
- 6509 Chagford Ln
- 6533 Chagford Ln
- 6824 Mapperton Dr
- 6836 Mapperton Dr
- 6503 Chagford Ln
- 6818 Mapperton Dr
- 6842 Mapperton Dr
- 6812 Mapperton Dr
- 6532 Chagford Ln
- 12704 Hawkstone Dr
- 6848 Mapperton Dr
- 6538 Chagford Ln
- 12698 Hawkstone Dr
- 12686 Hawkstone Dr
- 12801 Lane
- 6648 Helston Ln
- 6640 Helston Ln