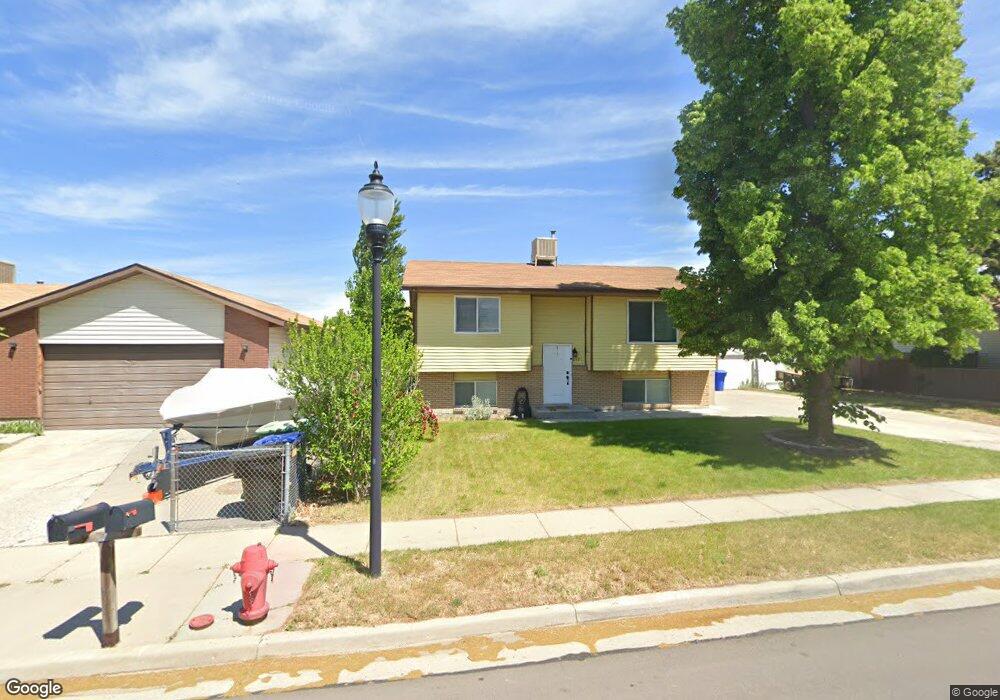
6521 S Begonia Dr West Jordan, UT 84081
Oquirrh NeighborhoodEstimated Value: $432,000 - $476,000
3
Beds
2
Baths
1,920
Sq Ft
$232/Sq Ft
Est. Value
About This Home
This home is located at 6521 S Begonia Dr, West Jordan, UT 84081 and is currently estimated at $445,614, approximately $232 per square foot. 6521 S Begonia Dr is a home located in Salt Lake County with nearby schools including Jim Bridger Elementary School, Thomas Jefferson Jr High School, and Kearns High School.
Ownership History
Date
Name
Owned For
Owner Type
Purchase Details
Closed on
Jul 3, 2017
Sold by
Vest Daniel W
Bought by
Vest Teri A
Current Estimated Value
Home Financials for this Owner
Home Financials are based on the most recent Mortgage that was taken out on this home.
Original Mortgage
$220,825
Outstanding Balance
$184,617
Interest Rate
4.12%
Mortgage Type
FHA
Estimated Equity
$260,997
Purchase Details
Closed on
Jun 29, 2017
Sold by
Vest Daniel W
Bought by
Vest Teri A
Home Financials for this Owner
Home Financials are based on the most recent Mortgage that was taken out on this home.
Original Mortgage
$220,825
Outstanding Balance
$184,617
Interest Rate
4.12%
Mortgage Type
FHA
Estimated Equity
$260,997
Purchase Details
Closed on
Sep 10, 1995
Sold by
Vest Daniel W
Bought by
Vest Teri A
Purchase Details
Closed on
Apr 27, 1994
Sold by
Vest Daniel W and Vest Teri A
Bought by
Vest Daniel W and Vest Teri A
Home Financials for this Owner
Home Financials are based on the most recent Mortgage that was taken out on this home.
Original Mortgage
$54,650
Interest Rate
7.79%
Create a Home Valuation Report for This Property
The Home Valuation Report is an in-depth analysis detailing your home's value as well as a comparison with similar homes in the area
Home Values in the Area
Average Home Value in this Area
Purchase History
| Date | Buyer | Sale Price | Title Company |
|---|---|---|---|
| Vest Teri A | -- | First American Title | |
| Vest Teri A | -- | First American Title | |
| Rushton Michelle | -- | Cottonwood Title | |
| Vest Teri A | -- | -- | |
| Vest Daniel W | -- | -- |
Source: Public Records
Mortgage History
| Date | Status | Borrower | Loan Amount |
|---|---|---|---|
| Open | Rushton Michelle | $220,825 | |
| Previous Owner | Vest Daniel W | $54,650 |
Source: Public Records
Tax History Compared to Growth
Tax History
| Year | Tax Paid | Tax Assessment Tax Assessment Total Assessment is a certain percentage of the fair market value that is determined by local assessors to be the total taxable value of land and additions on the property. | Land | Improvement |
|---|---|---|---|---|
| 2025 | $2,742 | $402,800 | $131,300 | $271,500 |
| 2024 | $2,742 | $380,100 | $123,800 | $256,300 |
| 2023 | $2,380 | $357,400 | $119,100 | $238,300 |
| 2022 | $2,339 | $357,200 | $116,700 | $240,500 |
| 2021 | $2,143 | $290,900 | $89,800 | $201,100 |
| 2020 | $1,967 | $252,400 | $89,800 | $162,600 |
| 2019 | $1,934 | $241,100 | $84,700 | $156,400 |
| 2018 | $1,841 | $221,500 | $84,700 | $136,800 |
| 2017 | $1,520 | $192,500 | $84,700 | $107,800 |
| 2016 | $1,412 | $177,700 | $84,700 | $93,000 |
| 2015 | $1,430 | $167,500 | $81,100 | $86,400 |
| 2014 | -- | $160,900 | $78,600 | $82,300 |
Source: Public Records
Map
Nearby Homes
- 6568 S 5180 W
- 5183 W Cadenza Dr
- 6489 S Daffodil Way
- 6635 S Milfoil Cir
- 6398 S Lobelia Dr
- 6437 S Lobelia Dr
- 6706 Marshrock Rd
- 4942 Saguaro Dr
- 6228 S Waller Ln
- 4909 Sakura Ct
- 6352 Moki Cir
- 4972 Wake Robin Dr
- 4946 W Pawnee Dr
- 6839 S Cyclamen Dr
- 5382 W Northlilac Ave
- 6157 S Impressions Dr
- 5557 W Joshua Cir
- 6853 Mullien Dr Unit 5420
- 6928 Beargrass Rd
- 6934 Sparrowtail Rd
- 6521 Begonia Dr
- 6531 S Begonia Dr
- 6511 S Begonia Dr
- 6531 S Begonia Dr
- 6511 Begonia Dr
- 6512 S 5180 W
- 6524 S 5180 W
- 6502 S 5180 W
- 6501 Begonia Dr
- 6501 S Begonia Dr
- 6506 Begonia Dr
- 6506 S Begonia Dr
- 5227 Begonia Way
- 5227 W Begonia Way
- 6541 Begonia Dr
- 6492 S 5180 W
- 6534 S 5180 W
- 6551 Begonia Dr
- 6486 Begonia Dr
- 5238 Begonia Way