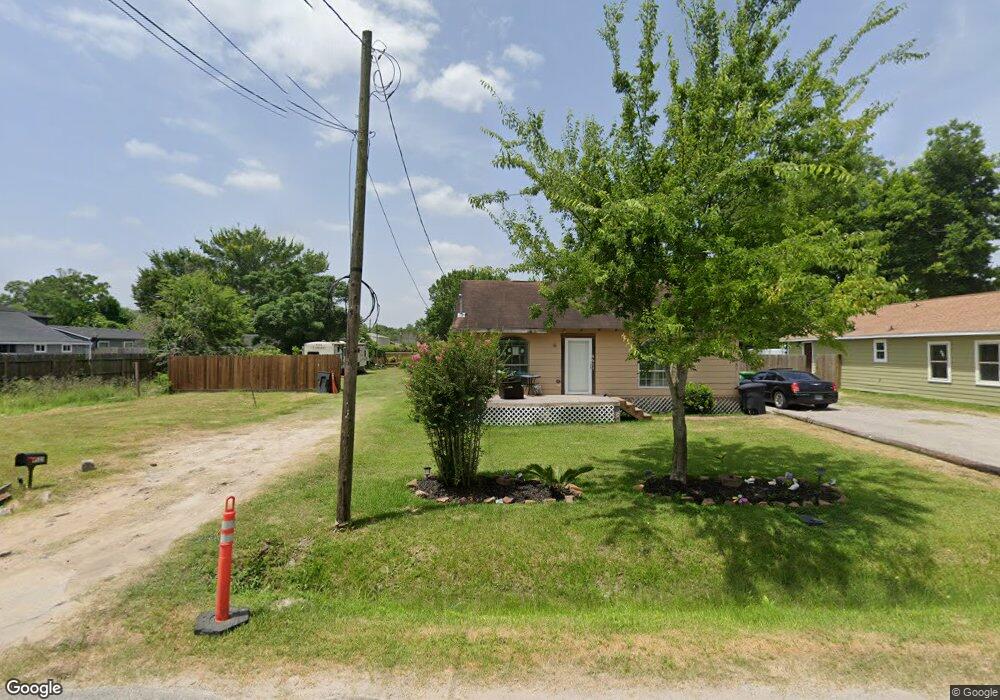
6523 Morrow St Houston, TX 77091
Acres Homes NeighborhoodEstimated Value: $104,000 - $176,000
2
Beds
1
Bath
928
Sq Ft
$149/Sq Ft
Est. Value
About This Home
This home is located at 6523 Morrow St, Houston, TX 77091 and is currently estimated at $138,667, approximately $149 per square foot. 6523 Morrow St is a home located in Harris County with nearby schools including Wesley Elementary School, Williams Middle, and Booker T Washington Sr High.
Ownership History
Date
Name
Owned For
Owner Type
Purchase Details
Closed on
Oct 13, 2010
Sold by
Casas Express Llc
Bought by
Jordan Perez Yulanda
Current Estimated Value
Home Financials for this Owner
Home Financials are based on the most recent Mortgage that was taken out on this home.
Original Mortgage
$28,349
Interest Rate
4.78%
Mortgage Type
Seller Take Back
Purchase Details
Closed on
Apr 15, 2010
Sold by
Gonzalez David D
Bought by
Casa Express Llc
Create a Home Valuation Report for This Property
The Home Valuation Report is an in-depth analysis detailing your home's value as well as a comparison with similar homes in the area
Home Values in the Area
Average Home Value in this Area
Purchase History
| Date | Buyer | Sale Price | Title Company |
|---|---|---|---|
| Jordan Perez Yulanda | -- | None Available | |
| Casa Express Llc | $5,000 | None Available |
Source: Public Records
Mortgage History
| Date | Status | Borrower | Loan Amount |
|---|---|---|---|
| Previous Owner | Jordan Perez Yulanda | $28,349 |
Source: Public Records
Tax History Compared to Growth
Tax History
| Year | Tax Paid | Tax Assessment Tax Assessment Total Assessment is a certain percentage of the fair market value that is determined by local assessors to be the total taxable value of land and additions on the property. | Land | Improvement |
|---|---|---|---|---|
| 2025 | $420 | $122,788 | $122,788 | -- |
| 2024 | $420 | $94,050 | $94,050 | -- |
| 2023 | $420 | -- | -- | -- |
| 2022 | $987 | $97,241 | $83,600 | $13,641 |
| 2021 | $950 | $67,671 | $54,863 | $12,808 |
| 2020 | $897 | $53,775 | $41,800 | $11,975 |
| 2019 | $852 | $40,336 | $29,260 | $11,076 |
| 2018 | $325 | $37,902 | $29,260 | $8,642 |
| 2017 | $704 | $29,355 | $20,900 | $8,455 |
| 2016 | $640 | $29,355 | $20,900 | $8,455 |
| 2015 | $283 | $23,000 | $20,900 | $2,100 |
| 2014 | $283 | $23,000 | $20,900 | $2,100 |
Source: Public Records
Map
Nearby Homes
- 0 Rosie St
- 6502 W Montgomery Rd
- 6738 W Montgomery Rd
- 833 Rosie St
- 0 De Priest St Unit 66567963
- 6610 Morrow St
- 778 Pickering St
- 6343 W Montgomery Rd
- 6341 W Montgomery Rd
- 843 Lovers Ln
- 6507 Radcliffe St
- 867 Lonnie Ln
- 00 Radcliffe St
- 860 Rachel St Unit D
- 860 Rachel St Unit C
- 862 Rachel St
- 853 Rachel St
- 6707 Knox St
- 1642 Plan A at Rachel Manor
- 1641 Plan B at Rachel Manor
- 6611 Morrow St
- 6613 Morrow St
- 6615 Morrow St
- 6405 De Priest St
- 6614 Morrow St
- 6419 De Priest St
- 6619 Morrow St
- 6612 W Montgomery Rd
- 6602 W Montgomery Rd
- 6637 Morrow St
- 6616 W Montgomery Rd
- 6516 W Montgomery Rd
- 6510 W Montgomery Rd
- 6701 Morrow St
- 6506 W Montgomery Rd
- 6423 De Priest St
- 6427 Morrow St
- 6429 Morrow St
- 6319 Morrow St
- 6640 W Montgomery Rd