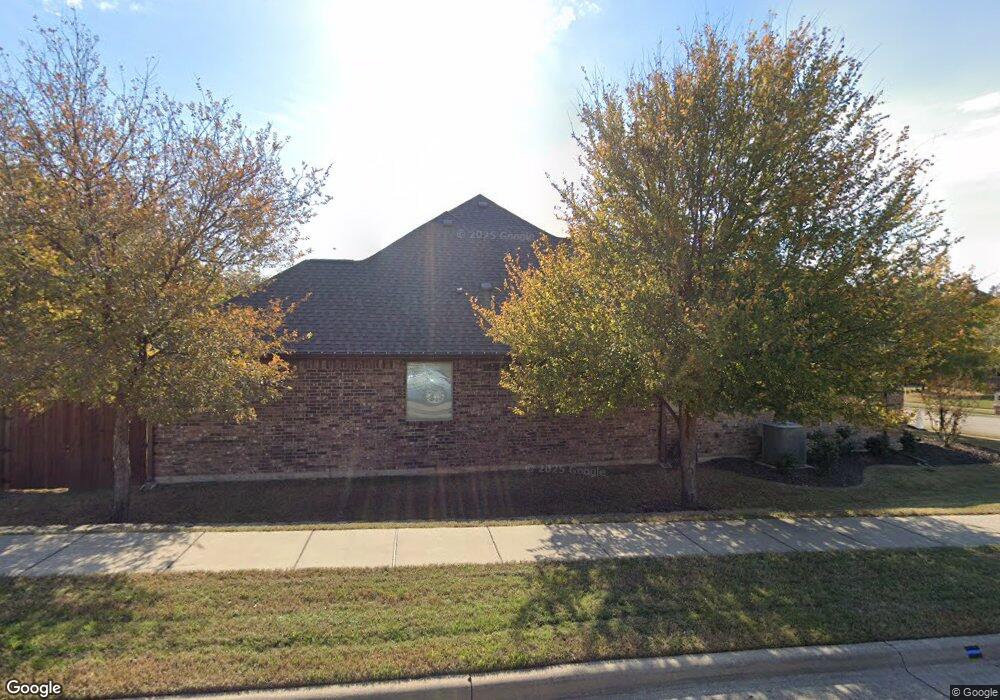
6524 Stone Creek Dr North Richland Hills, TX 76182
Estimated Value: $601,472 - $724,000
4
Beds
3
Baths
2,591
Sq Ft
$254/Sq Ft
Est. Value
About This Home
This home is located at 6524 Stone Creek Dr, North Richland Hills, TX 76182 and is currently estimated at $658,118, approximately $254 per square foot. 6524 Stone Creek Dr is a home with nearby schools including Walker Creek Elementary School, Smithfield Middle School, and Birdville High School.
Ownership History
Date
Name
Owned For
Owner Type
Purchase Details
Closed on
Aug 31, 2013
Sold by
Dustin Austin Enterprises Inc
Bought by
Ezzell Donald R and Ezzell Shelley A
Current Estimated Value
Home Financials for this Owner
Home Financials are based on the most recent Mortgage that was taken out on this home.
Original Mortgage
$318,008
Outstanding Balance
$244,288
Interest Rate
4.69%
Mortgage Type
Construction
Estimated Equity
$413,830
Purchase Details
Closed on
Aug 30, 2013
Sold by
J And J Nrh 100 Flp
Bought by
Dustin Austin Enterprises Inc
Home Financials for this Owner
Home Financials are based on the most recent Mortgage that was taken out on this home.
Original Mortgage
$318,008
Outstanding Balance
$244,288
Interest Rate
4.69%
Mortgage Type
Construction
Estimated Equity
$413,830
Create a Home Valuation Report for This Property
The Home Valuation Report is an in-depth analysis detailing your home's value as well as a comparison with similar homes in the area
Home Values in the Area
Average Home Value in this Area
Purchase History
| Date | Buyer | Sale Price | Title Company |
|---|---|---|---|
| Ezzell Donald R | -- | First Western Title Co | |
| Dustin Austin Enterprises Inc | -- | First Western Title Co |
Source: Public Records
Mortgage History
| Date | Status | Borrower | Loan Amount |
|---|---|---|---|
| Open | Ezzell Donald R | $318,008 |
Source: Public Records
Tax History Compared to Growth
Tax History
| Year | Tax Paid | Tax Assessment Tax Assessment Total Assessment is a certain percentage of the fair market value that is determined by local assessors to be the total taxable value of land and additions on the property. | Land | Improvement |
|---|---|---|---|---|
| 2025 | $9,770 | $558,372 | $115,000 | $443,372 |
| 2024 | $9,770 | $558,372 | $115,000 | $443,372 |
| 2023 | $9,062 | $533,000 | $115,000 | $418,000 |
| 2022 | $10,923 | $498,260 | $70,000 | $428,260 |
| 2021 | $10,501 | $412,672 | $70,000 | $342,672 |
| 2020 | $11,231 | $441,399 | $70,000 | $371,399 |
| 2019 | $10,904 | $414,065 | $63,000 | $351,065 |
| 2018 | $10,643 | $404,169 | $63,000 | $341,169 |
| 2017 | $10,301 | $382,868 | $70,000 | $312,868 |
| 2016 | $9,543 | $354,672 | $70,000 | $284,672 |
| 2015 | $2,915 | $384,260 | $70,000 | $314,260 |
| 2014 | $2,915 | $108,500 | $50,000 | $58,500 |
Source: Public Records
Map
Nearby Homes
- 6521 Rock Springs Dr
- 6505 Parkway Ave
- 736 Springhill Dr
- 712 Springhill Dr
- 8920 Martin Dr
- 712 Springwood Dr
- 6625 Crane Rd
- 6801 Woodland Hills Dr
- 6704 Nob Hill Ct
- 6708 Nob Hill Ct
- 2804 Ridgewood Dr
- 2908 Steve Dr
- 6509 Paula Ct
- 6432 Brynwyck Ln
- 2668 Bent Tree Dr
- 2809 Sandstone Dr
- 2829 Sandstone Dr
- 2844 Hurstview Dr
- 8886 Ice House Dr
- 7020 Live Oak Dr
- 6525 Rock Springs Dr
- 9209 Canoe Ridge Dr
- 6516 Stone Creek Dr
- 9205 Canoe Ridge Dr
- 6525 Stone Creek Dr
- 6521 Stone Creek Dr
- 9213 Canoe Ridge Dr
- 9201 Canoe Ridge Dr
- 6517 Rock Springs Dr
- 6517 Stone Creek Dr
- 9217 Canoe Ridge Dr
- 6512 Stone Creek Dr
- 6513 Rock Springs Dr
- 6520 Rock Springs Dr
- 6513 Stone Creek Dr
- 6608 Cedar Crest Dr
- 6516 Rock Springs Dr
- 6508 Stone Creek Dr
- 6520 Valleyview Dr
- 6509 Rock Springs Dr