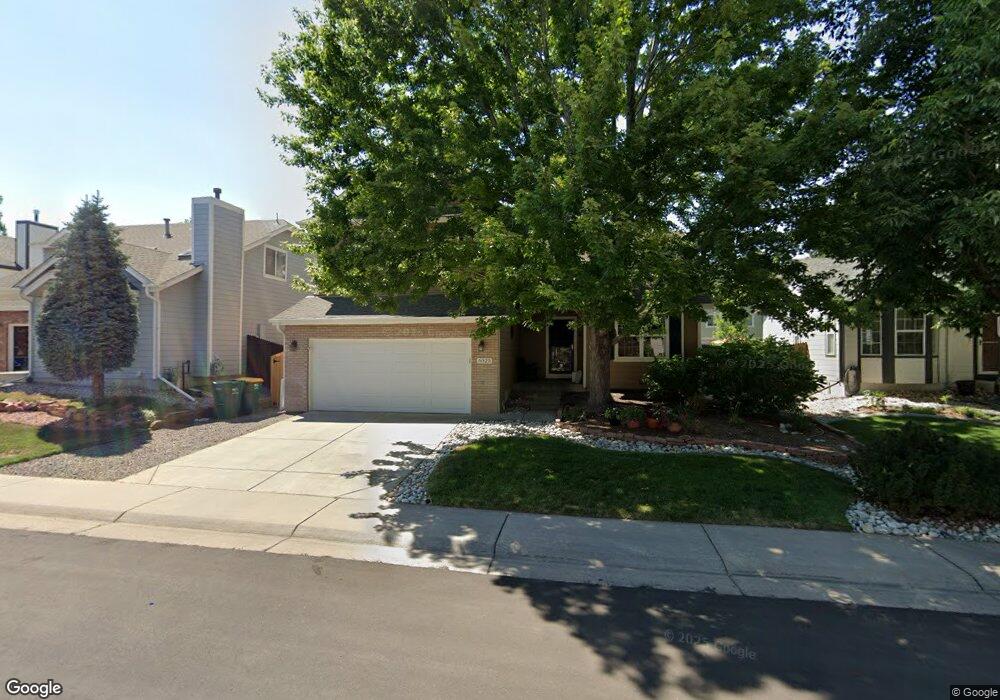
6525 Deframe Way Arvada, CO 80004
Ralston Valley NeighborhoodEstimated Value: $674,000 - $741,000
4
Beds
7
Baths
1,754
Sq Ft
$397/Sq Ft
Est. Value
About This Home
This home is located at 6525 Deframe Way, Arvada, CO 80004 and is currently estimated at $695,960, approximately $396 per square foot. 6525 Deframe Way is a home located in Jefferson County with nearby schools including Stott Elementary School, Oberon Middle School, and Arvada West High School.
Ownership History
Date
Name
Owned For
Owner Type
Purchase Details
Closed on
Oct 9, 2003
Sold by
Auriemma Vincent and Auriemma Kathleen H
Bought by
Auriemma Vincent G and Auriemma Kathleen H
Current Estimated Value
Home Financials for this Owner
Home Financials are based on the most recent Mortgage that was taken out on this home.
Original Mortgage
$236,685
Outstanding Balance
$112,040
Interest Rate
6.42%
Mortgage Type
Purchase Money Mortgage
Estimated Equity
$583,920
Purchase Details
Closed on
Nov 27, 2000
Sold by
Tammy Cooper Jeff R Cooper
Bought by
Auriemma Vincent and Auriemma Kathleen H
Home Financials for this Owner
Home Financials are based on the most recent Mortgage that was taken out on this home.
Original Mortgage
$232,750
Interest Rate
7.72%
Purchase Details
Closed on
Apr 19, 1994
Sold by
Village Homes Of Colorado Inc
Bought by
Cooper Jeff R and Cooper Tammy
Home Financials for this Owner
Home Financials are based on the most recent Mortgage that was taken out on this home.
Original Mortgage
$109,500
Interest Rate
7.61%
Create a Home Valuation Report for This Property
The Home Valuation Report is an in-depth analysis detailing your home's value as well as a comparison with similar homes in the area
Home Values in the Area
Average Home Value in this Area
Purchase History
| Date | Buyer | Sale Price | Title Company |
|---|---|---|---|
| Auriemma Vincent G | -- | Land Title Guarantee Company | |
| Auriemma Vincent | $245,000 | -- | |
| Cooper Jeff R | $142,352 | Land Title |
Source: Public Records
Mortgage History
| Date | Status | Borrower | Loan Amount |
|---|---|---|---|
| Open | Auriemma Vincent G | $236,685 | |
| Closed | Auriemma Vincent | $232,750 | |
| Previous Owner | Cooper Jeff R | $109,500 |
Source: Public Records
Tax History Compared to Growth
Tax History
| Year | Tax Paid | Tax Assessment Tax Assessment Total Assessment is a certain percentage of the fair market value that is determined by local assessors to be the total taxable value of land and additions on the property. | Land | Improvement |
|---|---|---|---|---|
| 2024 | $3,925 | $40,463 | $14,987 | $25,476 |
| 2023 | $3,925 | $40,463 | $14,987 | $25,476 |
| 2022 | $3,486 | $35,597 | $12,261 | $23,336 |
| 2021 | $3,544 | $36,622 | $12,614 | $24,008 |
| 2020 | $3,087 | $31,994 | $9,586 | $22,408 |
| 2019 | $3,046 | $31,994 | $9,586 | $22,408 |
| 2018 | $2,965 | $30,285 | $7,835 | $22,450 |
| 2017 | $2,715 | $30,285 | $7,835 | $22,450 |
| 2016 | $2,725 | $28,635 | $6,848 | $21,787 |
| 2015 | $2,515 | $28,635 | $6,848 | $21,787 |
| 2014 | $2,515 | $24,845 | $6,625 | $18,220 |
Source: Public Records
Map
Nearby Homes
- 13812 W 64th Place
- 6537 Coors St
- 13755 W 65th Dr
- 13553 W 65th Place
- 13432 W 65th Place
- 13245 W 63rd Cir
- 13618 W 62nd Dr
- 6416 Zang Ct
- 14050 W 68th Ave
- 13155 W 63rd Place
- 6254 Devinney Cir
- 6762 Beech Dr
- 6616 Zang Cir
- 12924 W 64th Dr Unit B
- 6060 Deframe Ct
- 13168 W 62nd Dr
- 6440 Wright St
- 7004 Beech Ct
- 12976 W 61st Cir
- 13304 W 70th Place
- 6535 Deframe Way
- 6515 Deframe Way
- 6528 Devinney St
- 6545 Deframe Way
- 6518 Devinney St
- 6538 Devinney St
- 6514 Deframe Way
- 6524 Deframe Way
- 6504 Deframe Way
- 6508 Devinney St
- 6495 Deframe Way
- 6534 Deframe Way
- 6494 Deframe Way
- 6498 Devinney St
- 6544 Deframe Way
- 13906 W 65th Dr
- 6511 Deframe Ct
- 6521 Deframe Ct
- 13887 W 65th Dr
- 13877 W 65th Dr