
Seller's Agent in 2021
Jim Greenslitt
Century 21 Four Seasons Realty
(208) 290-1683
20 in this area
69 Total Sales
Estimated Value: $245,245
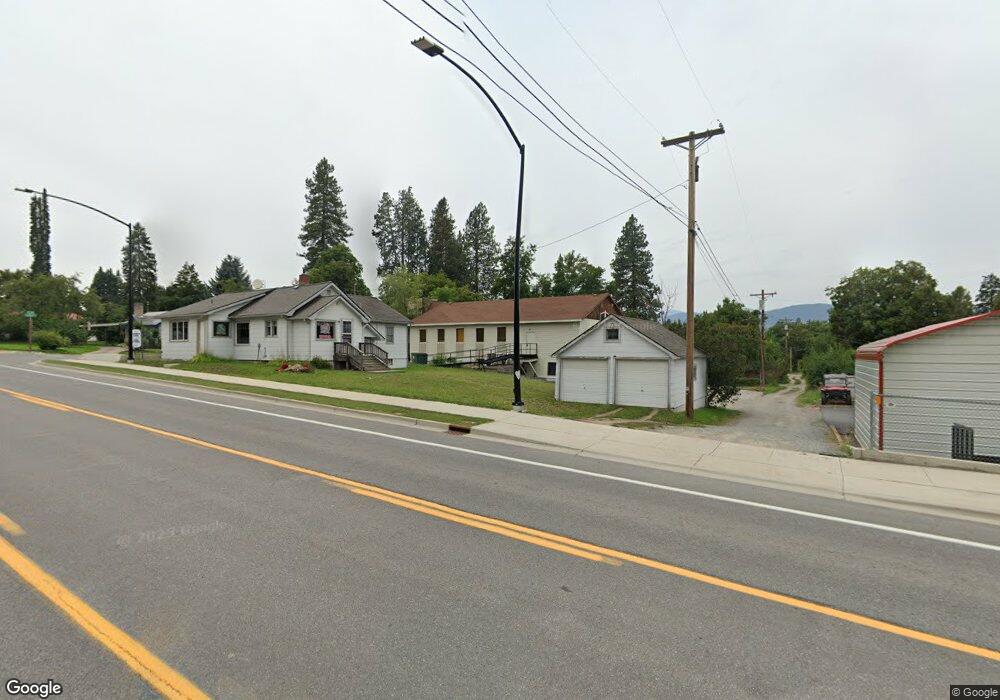
This home is located at 6525 Jackson St, Bonners Ferry, ID 83805 and is currently estimated at $245,245, approximately $39 per square foot. 6525 Jackson St is a home located in Boundary County with nearby schools including Bonners Ferry High School, Kootenai Valley Mennonite Church, and Mountain View Christian School.
| Date | Event | Price | List to Sale | Price per Sq Ft | Prior Sale |
|---|---|---|---|---|---|
| 06/11/2021 06/11/21 | Sold | -- | -- | -- | View Prior Sale |
| 05/25/2021 05/25/21 | Pending | -- | -- | -- | |
| 10/26/2020 10/26/20 | For Sale | $321,000 | -- | $52 / Sq Ft |
| Year | Tax Paid | Tax Assessment Tax Assessment Total Assessment is a certain percentage of the fair market value that is determined by local assessors to be the total taxable value of land and additions on the property. | Land | Improvement |
|---|---|---|---|---|
| 2025 | $1,555 | $215,600 | $51,030 | $164,570 |
| 2024 | $1,145 | $217,760 | $58,500 | $159,260 |
| 2023 | $1,145 | $161,360 | $54,220 | $107,140 |
| 2022 | $1,162 | $151,920 | $44,030 | $107,890 |
| 2021 | $1,567 | $135,540 | $32,690 | $102,850 |
| 2020 | $1,567 | $133,200 | $30,630 | $102,570 |
| 2019 | $1,975 | $128,100 | $26,520 | $101,580 |
| 2018 | $2,055 | $129,030 | $26,510 | $102,520 |
| 2017 | $2,041 | $128,820 | $26,510 | $102,310 |
| 2016 | $2,057 | $128,480 | $26,510 | $101,970 |
| 2015 | $2,047 | $26,510 | $26,510 | $0 |
| 2014 | $1,892 | $26,510 | $26,510 | $0 |
| 2013 | -- | $26,510 | $26,510 | $0 |
Seller's Agent in 2021
Jim Greenslitt
Century 21 Four Seasons Realty
(208) 290-1683
20 in this area
69 Total Sales