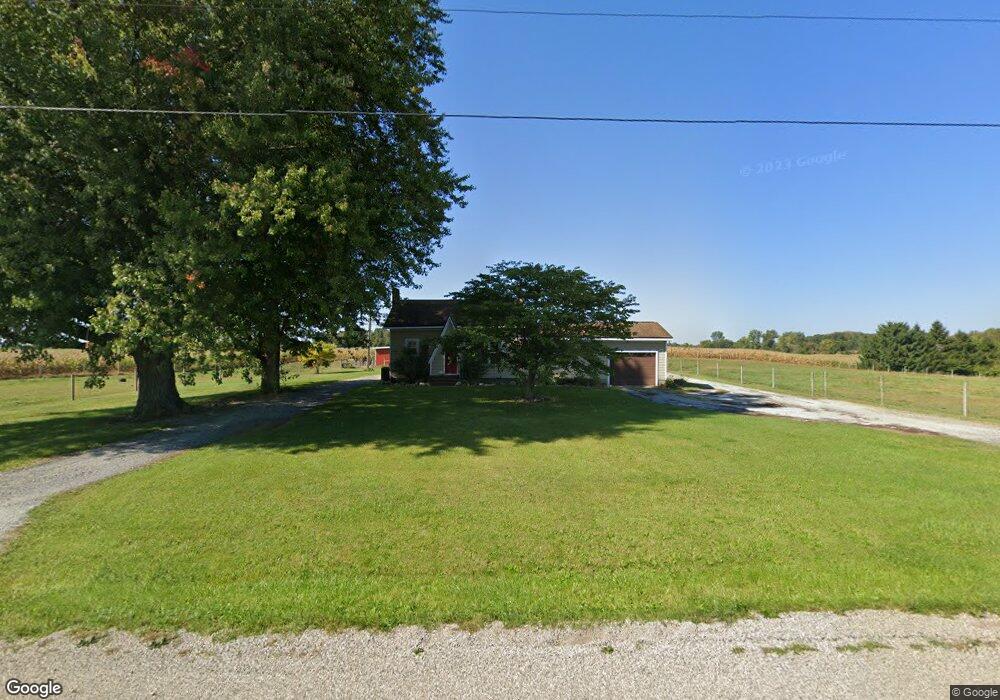
6525 S 800 W Pleasant Lake, IN 46779
Estimated Value: $243,393 - $297,000
3
Beds
1
Bath
1,544
Sq Ft
$174/Sq Ft
Est. Value
About This Home
This home is located at 6525 S 800 W, Pleasant Lake, IN 46779 and is currently estimated at $268,348, approximately $173 per square foot. 6525 S 800 W is a home located in Steuben County with nearby schools including Prairie Heights Elementary School, Prairie Heights Middle School, and Prairie Heights Senior High School.
Ownership History
Date
Name
Owned For
Owner Type
Purchase Details
Closed on
May 1, 2013
Sold by
Lorntz Trevor E
Bought by
Lepley Coy and Boots Allyson
Current Estimated Value
Home Financials for this Owner
Home Financials are based on the most recent Mortgage that was taken out on this home.
Original Mortgage
$112,244
Outstanding Balance
$79,680
Interest Rate
3.52%
Mortgage Type
New Conventional
Estimated Equity
$188,668
Purchase Details
Closed on
Jun 5, 2008
Sold by
Reinoehl Todd E
Bought by
Lorntz Trevor E
Home Financials for this Owner
Home Financials are based on the most recent Mortgage that was taken out on this home.
Original Mortgage
$103,772
Interest Rate
6.04%
Mortgage Type
FHA
Purchase Details
Closed on
Aug 22, 2006
Sold by
Reinoehl Terri L
Bought by
Reinoehl Todd E
Create a Home Valuation Report for This Property
The Home Valuation Report is an in-depth analysis detailing your home's value as well as a comparison with similar homes in the area
Home Values in the Area
Average Home Value in this Area
Purchase History
| Date | Buyer | Sale Price | Title Company |
|---|---|---|---|
| Lepley Coy | -- | None Available | |
| Coy | $110,000 | Lakeland Title | |
| Lorntz Trevor E | -- | None Available | |
| Reinoehl Todd E | -- | None Available |
Source: Public Records
Mortgage History
| Date | Status | Borrower | Loan Amount |
|---|---|---|---|
| Open | Coy | $112,244 | |
| Closed | Lepley Coy | $112,244 | |
| Previous Owner | Lorntz Trevor E | $103,772 |
Source: Public Records
Tax History Compared to Growth
Tax History
| Year | Tax Paid | Tax Assessment Tax Assessment Total Assessment is a certain percentage of the fair market value that is determined by local assessors to be the total taxable value of land and additions on the property. | Land | Improvement |
|---|---|---|---|---|
| 2024 | $743 | $178,300 | $50,100 | $128,200 |
| 2023 | $708 | $171,700 | $47,700 | $124,000 |
| 2022 | $749 | $153,800 | $41,500 | $112,300 |
| 2021 | $637 | $128,700 | $38,300 | $90,400 |
| 2020 | $621 | $123,300 | $32,300 | $91,000 |
| 2019 | $737 | $141,000 | $27,800 | $113,200 |
| 2018 | $465 | $104,000 | $20,600 | $83,400 |
| 2017 | $368 | $102,600 | $20,600 | $82,000 |
| 2016 | $344 | $98,700 | $20,600 | $78,100 |
| 2014 | $307 | $88,500 | $20,600 | $67,900 |
| 2013 | $307 | $89,800 | $20,600 | $69,200 |
Source: Public Records
Map
Nearby Homes
- 400 275 Turkey Lake Ln
- Lot 36 Lane 180 Turkey Lake
- Ln 230 A Lot 50 Ln
- Ln 230 A Lot 49 Ln
- Ln 230 A Lot 48 Ln
- Ln 230 A Lot 47 Ln
- Ln 230 A Lot 46 Ln
- Ln 230 A Lot 44 Ln
- Ln 230 A Lot 43 Ln
- Ln 230 A Lot 41 Ln
- Ln 230 A Lot 40 Ln
- Ln 220 Lot 39 Ln
- Ln 220 Lot 38 Ln
- Ln 220 Lot 37 Ln
- Ln 220 Lot 36 Ln
- Ln 220 Lot 35 Ln
- Ln 220 Lot 33 Ln
- Ln 220 Lot 32 Ln
- Ln 220 Lot 30 Ln
- Ln 220 Lot 29 Ln