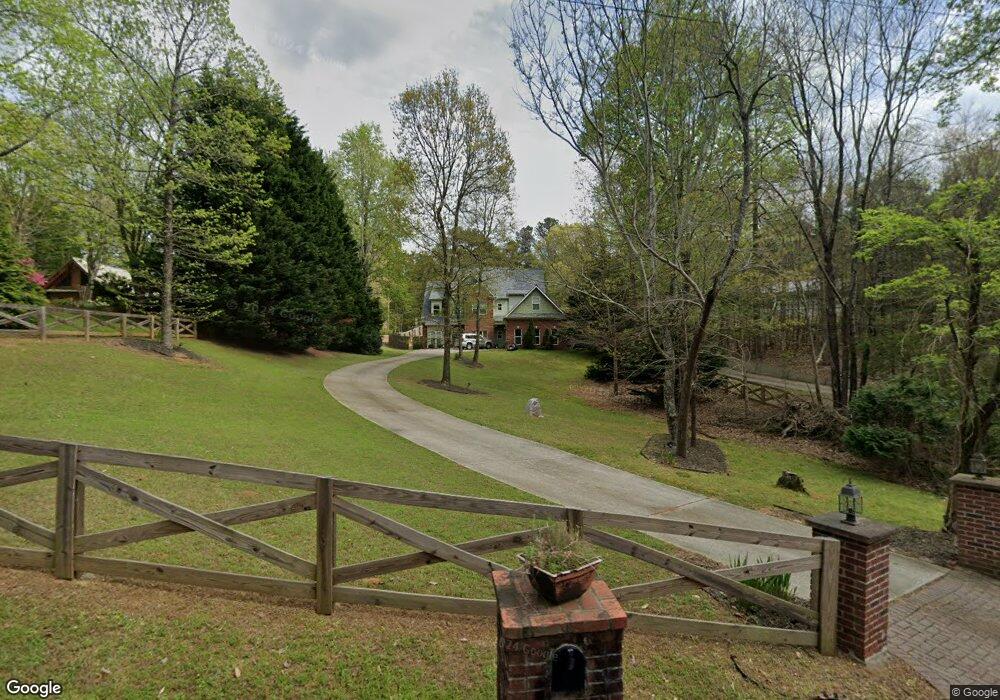
6526 Cox Dr Flowery Branch, GA 30542
Estimated Value: $646,509 - $990,000
5
Beds
4
Baths
3,186
Sq Ft
$241/Sq Ft
Est. Value
About This Home
This home is located at 6526 Cox Dr, Flowery Branch, GA 30542 and is currently estimated at $769,377, approximately $241 per square foot. 6526 Cox Dr is a home located in Hall County with nearby schools including Flowery Branch Elementary School, West Hall Middle School, and West Hall High School.
Ownership History
Date
Name
Owned For
Owner Type
Purchase Details
Closed on
May 4, 2011
Sold by
Pierce Mark A
Bought by
Arzabe Victor and Stanulus Kelly
Current Estimated Value
Home Financials for this Owner
Home Financials are based on the most recent Mortgage that was taken out on this home.
Original Mortgage
$220,000
Outstanding Balance
$152,678
Interest Rate
4.85%
Mortgage Type
New Conventional
Estimated Equity
$616,699
Purchase Details
Closed on
Dec 29, 2004
Sold by
Dhh Enterprises Inc
Bought by
Pierce Mark A
Home Financials for this Owner
Home Financials are based on the most recent Mortgage that was taken out on this home.
Original Mortgage
$314,000
Interest Rate
5.66%
Purchase Details
Closed on
Jun 16, 2004
Sold by
S & M Associates Ltd
Bought by
Dhh Enterprises Inc
Create a Home Valuation Report for This Property
The Home Valuation Report is an in-depth analysis detailing your home's value as well as a comparison with similar homes in the area
Home Values in the Area
Average Home Value in this Area
Purchase History
| Date | Buyer | Sale Price | Title Company |
|---|---|---|---|
| Arzabe Victor | $287,500 | -- | |
| Pierce Mark A | $56,000 | -- | |
| Dhh Enterprises Inc | $8,500 | -- | |
| Dhh Enterprises Inc | $8,500 | -- | |
| Dhh Enterprises Inc | $8,500 | -- | |
| Dhh Enterprises Inc | $8,500 | -- | |
| Dhh Enterprises Inc | $8,500 | -- | |
| Dhh Enterprises Inc | $8,500 | -- |
Source: Public Records
Mortgage History
| Date | Status | Borrower | Loan Amount |
|---|---|---|---|
| Open | Arzabe Victor | $220,000 | |
| Previous Owner | Pierce Mark A | $314,000 |
Source: Public Records
Tax History Compared to Growth
Tax History
| Year | Tax Paid | Tax Assessment Tax Assessment Total Assessment is a certain percentage of the fair market value that is determined by local assessors to be the total taxable value of land and additions on the property. | Land | Improvement |
|---|---|---|---|---|
| 2024 | $5,458 | $220,128 | $10,440 | $209,688 |
| 2023 | $4,791 | $208,920 | $10,440 | $198,480 |
| 2022 | $4,822 | $186,460 | $20,880 | $165,580 |
| 2021 | $4,749 | $180,280 | $21,200 | $159,080 |
| 2020 | $4,681 | $172,640 | $21,200 | $151,440 |
| 2019 | $4,583 | $167,520 | $21,200 | $146,320 |
| 2018 | $4,152 | $146,830 | $21,200 | $125,630 |
| 2017 | $4,109 | $146,830 | $21,200 | $125,630 |
| 2016 | $4,009 | $146,830 | $21,200 | $125,630 |
| 2015 | $4,097 | $146,830 | $21,200 | $125,630 |
| 2014 | $4,097 | $146,830 | $21,200 | $125,630 |
Source: Public Records
Map
Nearby Homes