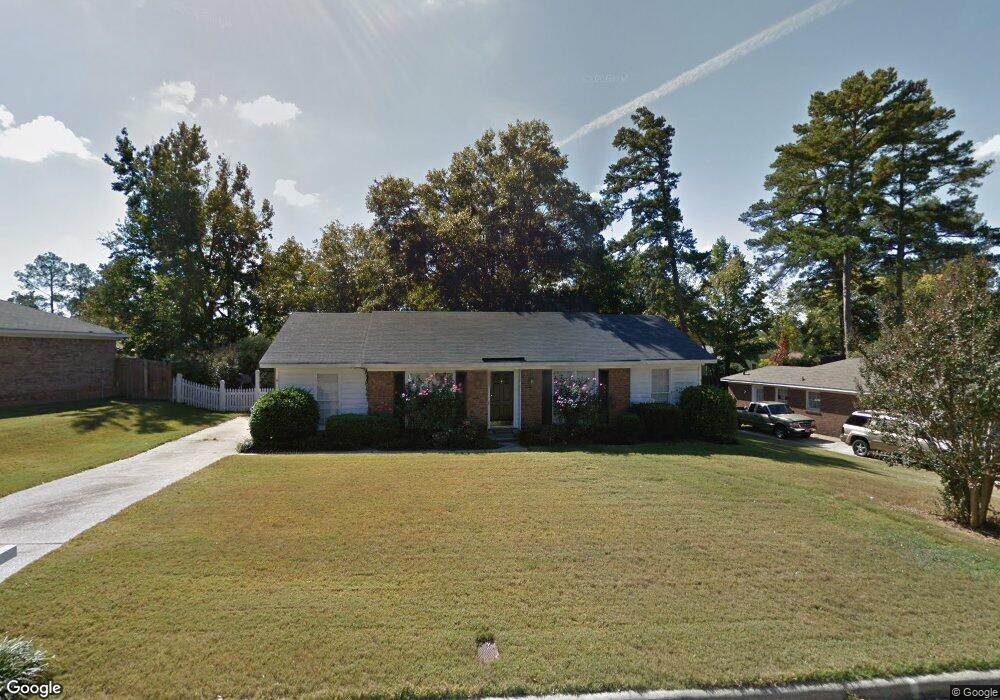
6527 Malibu Dr Columbus, GA 31909
Northern Columbus NeighborhoodEstimated Value: $182,000 - $195,803
3
Beds
3
Baths
1,500
Sq Ft
$126/Sq Ft
Est. Value
About This Home
This home is located at 6527 Malibu Dr, Columbus, GA 31909 and is currently estimated at $189,451, approximately $126 per square foot. 6527 Malibu Dr is a home located in Muscogee County with nearby schools including Eagle Ridge Academy, Blackmon Road Middle School, and Shaw High School.
Ownership History
Date
Name
Owned For
Owner Type
Purchase Details
Closed on
Oct 2, 2024
Sold by
Johnson Evan
Bought by
Moore Smith Elizabeth
Current Estimated Value
Purchase Details
Closed on
Nov 13, 2010
Sold by
Johnson Melissa Beth and Johnson Melissa
Bought by
Johnson Evan
Purchase Details
Closed on
Jun 15, 2009
Sold by
Johnson Evan
Bought by
Johnson Melissa
Home Financials for this Owner
Home Financials are based on the most recent Mortgage that was taken out on this home.
Original Mortgage
$148,600
Interest Rate
4.79%
Mortgage Type
VA
Purchase Details
Closed on
May 15, 2009
Sold by
Smith Sherri Necoal and Diskin Cynthia J
Bought by
Johnson Evan
Home Financials for this Owner
Home Financials are based on the most recent Mortgage that was taken out on this home.
Original Mortgage
$148,600
Interest Rate
4.79%
Mortgage Type
VA
Create a Home Valuation Report for This Property
The Home Valuation Report is an in-depth analysis detailing your home's value as well as a comparison with similar homes in the area
Home Values in the Area
Average Home Value in this Area
Purchase History
| Date | Buyer | Sale Price | Title Company |
|---|---|---|---|
| Moore Smith Elizabeth | $175,000 | None Listed On Document | |
| Johnson Evan | -- | None Available | |
| Johnson Melissa | -- | None Available | |
| Johnson Evan | $145,500 | None Available |
Source: Public Records
Mortgage History
| Date | Status | Borrower | Loan Amount |
|---|---|---|---|
| Previous Owner | Johnson Evan | $148,600 |
Source: Public Records
Tax History Compared to Growth
Tax History
| Year | Tax Paid | Tax Assessment Tax Assessment Total Assessment is a certain percentage of the fair market value that is determined by local assessors to be the total taxable value of land and additions on the property. | Land | Improvement |
|---|---|---|---|---|
| 2025 | $2,611 | $66,692 | $9,876 | $56,816 |
| 2024 | $236 | $60,360 | $9,876 | $50,484 |
| 2023 | $2,378 | $60,360 | $9,876 | $50,484 |
| 2022 | $2,115 | $51,788 | $9,876 | $41,912 |
| 2021 | $1,832 | $44,876 | $9,876 | $35,000 |
| 2020 | $1,833 | $44,876 | $9,876 | $35,000 |
| 2019 | $1,839 | $44,876 | $9,876 | $35,000 |
| 2018 | $1,839 | $44,876 | $9,876 | $35,000 |
| 2017 | $1,844 | $44,876 | $9,876 | $35,000 |
| 2016 | $1,903 | $46,121 | $6,486 | $39,635 |
| 2015 | $1,905 | $46,121 | $6,486 | $39,635 |
| 2014 | $2,401 | $58,074 | $6,486 | $51,588 |
| 2013 | -- | $58,074 | $6,486 | $51,588 |
Source: Public Records
Map
Nearby Homes
- 5011 Montego Dr
- 5041 Montego Dr
- 5042 Foxfire Dr
- 6500 Charter Oaks Cir
- 6630 Lemans Ln
- 5045 Old Post Rd
- 4715 Teak Dr
- 209 Plum Ct
- 4627 Wimbish Ct
- 6736 Charter Oaks Cir
- 4417 Sibley St
- 5378 Misty Ln
- 6137 Stoneway Dr
- 6528 Yellow Stone Ct
- 6136 Morningside Dr
- 6333 Stony Creek Dr
- 6263 Potomac Cir
- 4245 N Oaks Dr
- 4764 Bridlewood Dr
- 6127 Stony Creek Dr
- 6519 Malibu Dr
- 6535 Malibu Dr
- 5015 Montego Dr
- 6513 Malibu Dr
- 6543 Malibu Dr
- 6526 Malibu Dr
- 5021 Montego Dr
- 5005 Montego Dr
- 6532 Malibu Dr
- 6520 Malibu Dr
- 6540 Malibu Dr
- 6514 Malibu Dr
- 6549 Malibu Dr
- 6507 Malibu Dr
- 5027 Montego Dr
- 5001 Montego Dr
- 6546 Malibu Dr
- 0 Montego Dr
- 6508 Malibu Dr
- 4932 Basswood Dr