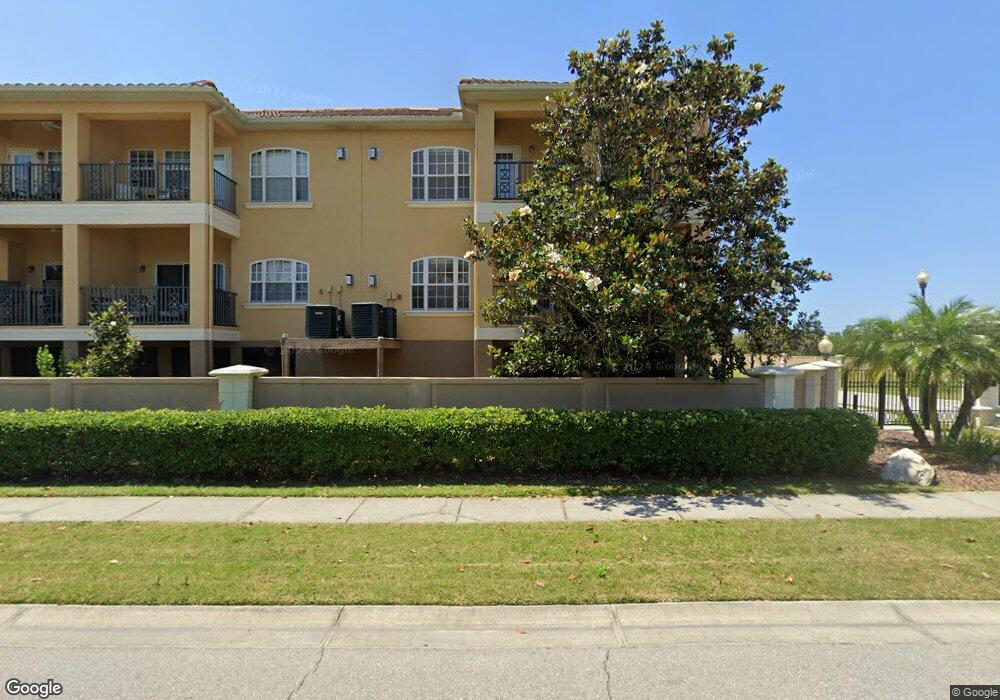
6527 Sand Shore Ln New Port Richey, FL 34652
New Port Richey West NeighborhoodEstimated Value: $535,009 - $660,000
3
Beds
3
Baths
4,238
Sq Ft
$136/Sq Ft
Est. Value
About This Home
This home is located at 6527 Sand Shore Ln, New Port Richey, FL 34652 and is currently estimated at $577,252, approximately $136 per square foot. 6527 Sand Shore Ln is a home located in Pasco County with nearby schools including Richey Elementary School, Gulf Middle School, and Gulf High School.
Ownership History
Date
Name
Owned For
Owner Type
Purchase Details
Closed on
May 31, 2018
Sold by
Mcintosh Clive and Aoua Maha
Bought by
Broughman Thomas A and Broughman Mary Ellen
Current Estimated Value
Purchase Details
Closed on
Jul 7, 2017
Sold by
Mcintosh Clive
Bought by
Mcintosh Clive and Aoua Maha
Purchase Details
Closed on
Jul 11, 2016
Sold by
Faggart Danielle N
Bought by
Mclntosh Clive
Purchase Details
Closed on
Jul 1, 2016
Bought by
Mcintosh Clive
Purchase Details
Closed on
May 4, 2012
Sold by
Christenson Denis P and Christenson Judith A
Bought by
Faggart Danielle N
Home Financials for this Owner
Home Financials are based on the most recent Mortgage that was taken out on this home.
Original Mortgage
$258,282
Interest Rate
4.37%
Mortgage Type
FHA
Purchase Details
Closed on
Mar 19, 2010
Sold by
Rsf Pasco Llc
Bought by
Christenson Denis P and Christenson Judith A
Create a Home Valuation Report for This Property
The Home Valuation Report is an in-depth analysis detailing your home's value as well as a comparison with similar homes in the area
Home Values in the Area
Average Home Value in this Area
Purchase History
| Date | Buyer | Sale Price | Title Company |
|---|---|---|---|
| Broughman Thomas A | $315,000 | Capstone Title Llc | |
| Mcintosh Clive | $120,000 | Attorney | |
| Mclntosh Clive | -- | None Available | |
| Mcintosh Clive | $100 | -- | |
| Faggart Danielle N | $265,000 | Tampa Bay Title Llc | |
| Christenson Denis P | $250,000 | Palmetto Title Llc |
Source: Public Records
Mortgage History
| Date | Status | Borrower | Loan Amount |
|---|---|---|---|
| Previous Owner | Faggart Danielle N | $258,282 |
Source: Public Records
Tax History Compared to Growth
Tax History
| Year | Tax Paid | Tax Assessment Tax Assessment Total Assessment is a certain percentage of the fair market value that is determined by local assessors to be the total taxable value of land and additions on the property. | Land | Improvement |
|---|---|---|---|---|
| 2025 | $3,215 | $224,820 | -- | -- |
| 2024 | $3,215 | $218,490 | -- | -- |
| 2023 | $3,092 | $212,130 | $0 | $0 |
| 2022 | $2,773 | $205,960 | $0 | $0 |
| 2021 | $2,717 | $199,970 | $42,000 | $157,970 |
| 2020 | $2,615 | $193,709 | $42,000 | $151,709 |
| 2019 | $4,588 | $274,121 | $42,000 | $232,121 |
| 2018 | $4,013 | $237,981 | $38,400 | $199,581 |
| 2017 | $3,791 | $220,013 | $38,400 | $181,613 |
| 2016 | $3,735 | $215,952 | $38,400 | $177,552 |
| 2015 | $3,719 | $210,513 | $38,400 | $172,113 |
| 2014 | $3,574 | $206,038 | $38,400 | $167,638 |
Source: Public Records
Map
Nearby Homes
- 6513 Sand Shore Ln
- 6517 Channelside Dr
- 4632 Heavens Way
- 6344 Spoonbill Dr
- 6340 Spoonbill Dr
- 6711 Arroyo Dr
- 6679 Wander Ln
- 0 Tiberius Trail
- 6707 Wander Ln
- 6715 Wander Ln
- 6316 Spoonbill Dr
- 4848 Hermes Way
- 4795 Hermes Way
- 4819 Hermes Way
- 4792 Hermes Way
- 4803 Hermes Way
- 4832 Hermes Way
- 4830 Opus Way
- 6312 Spoonbill Dr
- 4425 Gulfside Dr
- 6527 Sand Shore Ln
- 6523 Sand Shore Ln
- 6521 Sand Shore Ln
- 6519 Sand Shore Ln
- 4551 Heron Lodge
- 4603 Heron Lodge
- 4605 Heron Lodge
- 4547 Heron Landing
- 4547 Heron Lodge
- 6517 Sand Shore Ln
- 4607 Heron Lodge
- 6528 Sand Shore Ln
- 6524 Sand Shore Ln
- 4543 Heron Landing
- 4543 Heron Lodge
- 4609 Heron Lodge
- 6522 Sand Shore Ln
- 6522 Sand Shore Ln Unit 39
- 6520 Sand Shore Ln
- 4370 Green Key Rd