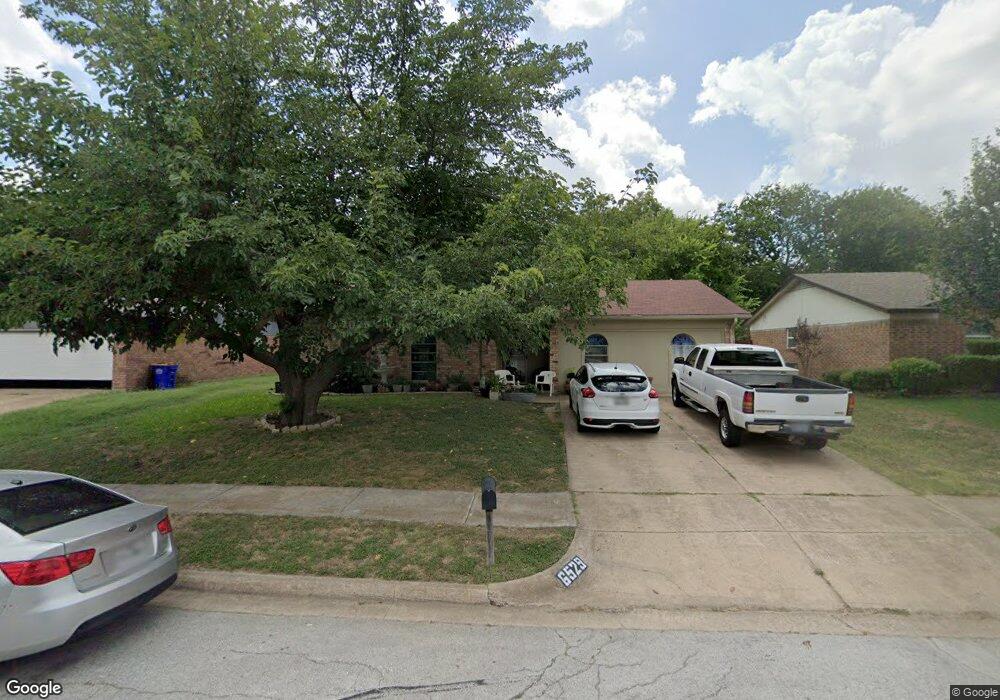
6529 Memory Ln Watauga, TX 76148
Estimated Value: $273,000 - $294,649
5
Beds
2
Baths
1,690
Sq Ft
$168/Sq Ft
Est. Value
About This Home
This home is located at 6529 Memory Ln, Watauga, TX 76148 and is currently estimated at $284,162, approximately $168 per square foot. 6529 Memory Ln is a home located in Tarrant County with nearby schools including Grace E Hardeman Elementary School, Watauga Middle School, and Haltom High School.
Ownership History
Date
Name
Owned For
Owner Type
Purchase Details
Closed on
Oct 28, 2019
Sold by
Simpson Richard
Bought by
Pate Kevin Wayne
Current Estimated Value
Home Financials for this Owner
Home Financials are based on the most recent Mortgage that was taken out on this home.
Original Mortgage
$171,830
Outstanding Balance
$151,226
Interest Rate
3.62%
Mortgage Type
FHA
Estimated Equity
$132,936
Purchase Details
Closed on
Jan 15, 2015
Sold by
Mian Raza
Bought by
Simpson Richard
Home Financials for this Owner
Home Financials are based on the most recent Mortgage that was taken out on this home.
Original Mortgage
$104,080
Interest Rate
4.25%
Mortgage Type
FHA
Purchase Details
Closed on
Apr 9, 2012
Sold by
Mian Raza
Bought by
Mian Raza
Purchase Details
Closed on
Aug 8, 2008
Sold by
Stallings Larry B
Bought by
Mian N T
Create a Home Valuation Report for This Property
The Home Valuation Report is an in-depth analysis detailing your home's value as well as a comparison with similar homes in the area
Home Values in the Area
Average Home Value in this Area
Purchase History
| Date | Buyer | Sale Price | Title Company |
|---|---|---|---|
| Pate Kevin Wayne | -- | Mcknight Title | |
| Simpson Richard | -- | None Available | |
| Mian Raza | -- | None Available | |
| Mian N T | $62,000 | None Available |
Source: Public Records
Mortgage History
| Date | Status | Borrower | Loan Amount |
|---|---|---|---|
| Open | Pate Kevin Wayne | $171,830 | |
| Previous Owner | Simpson Richard | $104,080 |
Source: Public Records
Tax History Compared to Growth
Tax History
| Year | Tax Paid | Tax Assessment Tax Assessment Total Assessment is a certain percentage of the fair market value that is determined by local assessors to be the total taxable value of land and additions on the property. | Land | Improvement |
|---|---|---|---|---|
| 2025 | $4,862 | $242,296 | $50,000 | $192,296 |
| 2024 | $4,862 | $281,740 | $50,000 | $231,740 |
| 2023 | $5,762 | $264,287 | $50,000 | $214,287 |
| 2022 | $5,593 | $257,175 | $25,000 | $232,175 |
| 2021 | $5,338 | $215,208 | $25,000 | $190,208 |
| 2020 | $4,859 | $190,337 | $25,000 | $165,337 |
| 2019 | $3,972 | $187,528 | $25,000 | $162,528 |
| 2018 | $3,247 | $136,235 | $25,000 | $111,235 |
| 2017 | $3,343 | $125,034 | $25,000 | $100,034 |
| 2016 | $3,039 | $112,591 | $15,000 | $97,591 |
| 2015 | $2,769 | $103,800 | $10,500 | $93,300 |
| 2014 | $2,769 | $103,800 | $10,500 | $93,300 |
Source: Public Records
Map
Nearby Homes
- 6620 Bernadine Dr
- 6601 Charmaine Dr
- 6613 Mona Lisa Ave
- 6421 Perdido Dr
- 6051 Oakdale Ct
- 6051 Shadydale Ct
- 6437 Route 66
- 6608 Emily Dr
- 6428 Carousel Dr
- 6500 Avalon Dr
- 6036 Lindy Ln
- 6904 Echo Hill Dr
- 6608 Summertime Ln
- 6608 Murel Dr
- 6632 Richardson Dr
- 6009 Deborah Ln
- 6024 Hillcrest Dr
- 6604 Whitley Rd
- 7020 Thomas Place
- 6617 Whitley Rd
- 6601 Memory Ln
- 6525 Memory Ln
- 6544 Bernadine Dr
- 6605 Memory Ln
- 6521 Memory Ln
- 6600 Bernadine Dr
- 6540 Bernadine Dr
- 6536 Bernadine Dr
- 6604 Bernadine Dr
- 6528 Memory Ln
- 6600 Memory Ln
- 6524 Memory Ln
- 6609 Memory Ln
- 6517 Memory Ln
- 6604 Memory Ln
- 6520 Memory Ln
- 6532 Bernadine Dr
- 6608 Bernadine Dr
- 6613 Memory Ln
- 6608 Memory Ln