Estimated Value: $119,000 - $168,000
3
Beds
1
Bath
1,058
Sq Ft
$126/Sq Ft
Est. Value
About This Home
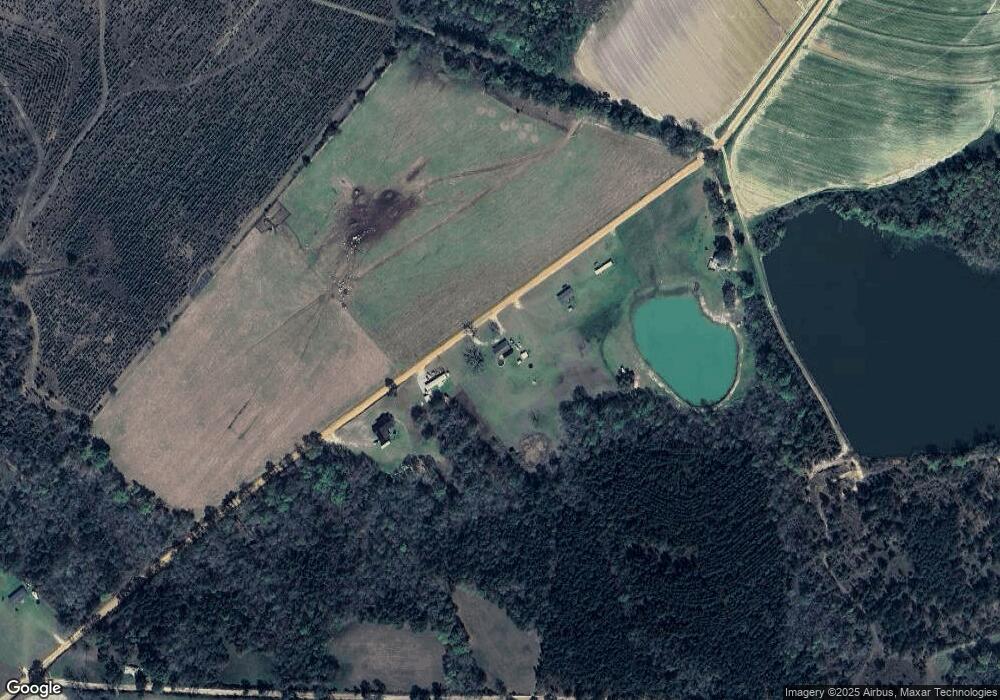
This home is located at 653 Alex Hardwick Rd, Lyons, GA 30436 and is currently estimated at $132,882, approximately $125 per square foot. 653 Alex Hardwick Rd is a home located in Toombs County with nearby schools including Toombs County High School.
Ownership History
Date
Name
Owned For
Owner Type
Purchase Details
Closed on
Jul 16, 2020
Sold by
Harden Durelle M
Bought by
Hulett Tonya Marie and Hulett Daniel Jason
Current Estimated Value
Purchase Details
Closed on
Aug 2, 2012
Sold by
Napier N Lorraine
Bought by
Harden Durrelle M and Harden Ellen M
Purchase Details
Closed on
Dec 30, 2010
Sold by
Napier Lorraine N
Bought by
Harden Durrelle M and Harden Ellen M
Purchase Details
Closed on
Feb 17, 2009
Sold by
Hsbc Mortgage Services Inc
Bought by
Napier N Lorraine
Home Financials for this Owner
Home Financials are based on the most recent Mortgage that was taken out on this home.
Original Mortgage
$10,602
Interest Rate
5.15%
Mortgage Type
Unknown
Purchase Details
Closed on
Aug 5, 2008
Sold by
Harden Durelle M
Bought by
Hsbc Mortgage Services Inc
Purchase Details
Closed on
Jun 6, 2003
Sold by
Harden Durelle and Harden Ele
Bought by
Harden Durelle M and Harden Christina A
Purchase Details
Closed on
Nov 20, 1989
Bought by
Harden Durelle and Harden Ele
Create a Home Valuation Report for This Property
The Home Valuation Report is an in-depth analysis detailing your home's value as well as a comparison with similar homes in the area
Purchase History
| Date | Buyer | Sale Price | Title Company |
|---|---|---|---|
| Hulett Tonya Marie | -- | -- | |
| Harden Durrelle M | $2,000 | -- | |
| Harden Durrelle M | -- | -- | |
| Napier N Lorraine | $20,000 | -- | |
| Hsbc Mortgage Services Inc | $38,060 | -- | |
| Harden Durelle M | $12,000 | -- | |
| Harden Durelle | $46,500 | -- |
Source: Public Records
Mortgage History
| Date | Status | Borrower | Loan Amount |
|---|---|---|---|
| Previous Owner | Napier N Lorraine | $10,602 |
Source: Public Records
Tax History
| Year | Tax Paid | Tax Assessment Tax Assessment Total Assessment is a certain percentage of the fair market value that is determined by local assessors to be the total taxable value of land and additions on the property. | Land | Improvement |
|---|---|---|---|---|
| 2025 | $662 | $39,130 | $5,507 | $33,623 |
| 2024 | $676 | $39,130 | $5,507 | $33,623 |
| 2023 | $656 | $37,004 | $3,786 | $33,218 |
| 2022 | $643 | $33,008 | $3,786 | $29,222 |
| 2021 | $658 | $29,484 | $2,754 | $26,730 |
Source: Public Records
Map
Nearby Homes
- 212 Marvin Church Rd
- 0 Us Highway 1 Unit 10526168
- 2257 Harden Chapel Rd
- 334 Hidden Hammock
- Collie Williams Rd
- 1833 Tom Odum Rd
- 600 Thompson Level Rd
- 0 Thompson Level Rd
- LOT 2 Thompson Level Rd
- Lots 91,92,93 & Trac Charles Spikes Rd
- 00 Charles Spikes Rd
- LOTS 91,92,93 & Charles Spikes Rd
- 760 Darrell Thompson Rd
- 657 Georgia 147
- 451 Tom McDonald Rd
- 4822 Georgia 15
- 445 Southside Dr
- 0 Gray's Landing Rd Unit 23834
- 0 Gray's Landing Rd Unit 10647341
- 000 Green Oak Rd
- 695 Alex Hardwick Rd
- 567 Alex Hardwick Rd
- 701 Alex Hardwick Rd
- 818 Alex Hardwick Rd
- 834 Alex Hardwick Rd
- 881 Alex Hardwick Rd
- 0 Alex Hardwick Rd Unit 7098189
- 349 Charlie W Williams Rd
- 220 Maxwell Oneal Rd
- 321 Charlie W Williams Rd
- 00 Charlie W Williams Rd
- 319 Charlie W Williams Rd
- 331 Charlie W Williams Rd
- 279 Charlie W Williams Rd
- 1160 Marvin Church Rd
- 1234 Marvin Church Rd
- 525 Parker Banks Rd
- 575 Parker Banks Rd
Your Personal Tour Guide
Ask me questions while you tour the home.