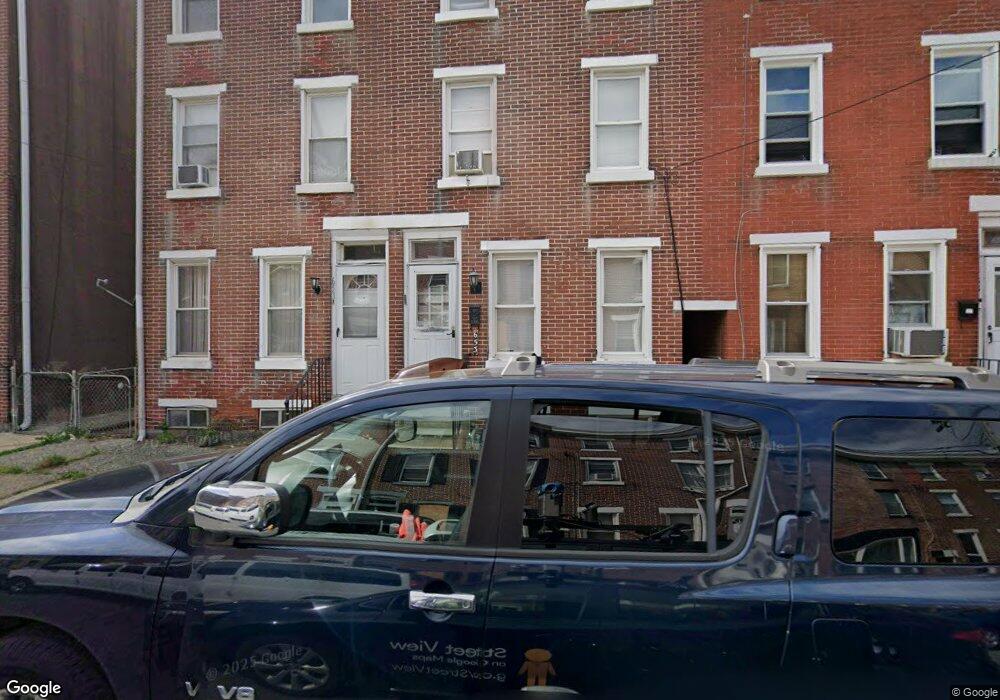
653 Corson St Norristown, PA 19401
Estimated Value: $186,132 - $215,000
3
Beds
1
Bath
1,496
Sq Ft
$135/Sq Ft
Est. Value
About This Home
This home is located at 653 Corson St, Norristown, PA 19401 and is currently estimated at $201,533, approximately $134 per square foot. 653 Corson St is a home located in Montgomery County with nearby schools including Davenport Elementary School, Charles Blockson Middle School, and East Norriton Middle School.
Ownership History
Date
Name
Owned For
Owner Type
Purchase Details
Closed on
Jan 24, 2017
Sold by
Three Blind Mice Lp
Bought by
S And J Property Group Llc
Current Estimated Value
Home Financials for this Owner
Home Financials are based on the most recent Mortgage that was taken out on this home.
Original Mortgage
$175,000
Outstanding Balance
$145,377
Interest Rate
4.32%
Mortgage Type
Future Advance Clause Open End Mortgage
Estimated Equity
$56,156
Purchase Details
Closed on
Mar 29, 2007
Sold by
Evans Virginia and Gordon Virginia L
Bought by
Three Blind Mice Lp
Home Financials for this Owner
Home Financials are based on the most recent Mortgage that was taken out on this home.
Original Mortgage
$83,200
Interest Rate
6.24%
Create a Home Valuation Report for This Property
The Home Valuation Report is an in-depth analysis detailing your home's value as well as a comparison with similar homes in the area
Home Values in the Area
Average Home Value in this Area
Purchase History
| Date | Buyer | Sale Price | Title Company |
|---|---|---|---|
| S And J Property Group Llc | $22,500,000 | None Available | |
| Three Blind Mice Lp | $104,000 | None Available |
Source: Public Records
Mortgage History
| Date | Status | Borrower | Loan Amount |
|---|---|---|---|
| Open | S And J Property Group Llc | $175,000 | |
| Previous Owner | Three Blind Mice Lp | $83,200 |
Source: Public Records
Tax History Compared to Growth
Tax History
| Year | Tax Paid | Tax Assessment Tax Assessment Total Assessment is a certain percentage of the fair market value that is determined by local assessors to be the total taxable value of land and additions on the property. | Land | Improvement |
|---|---|---|---|---|
| 2025 | $3,297 | $53,730 | $16,250 | $37,480 |
| 2024 | $3,297 | $53,730 | $16,250 | $37,480 |
| 2023 | $3,268 | $53,730 | $16,250 | $37,480 |
| 2022 | $3,198 | $53,730 | $16,250 | $37,480 |
| 2021 | $3,182 | $53,730 | $16,250 | $37,480 |
| 2020 | $3,036 | $53,730 | $16,250 | $37,480 |
| 2019 | $2,980 | $53,730 | $16,250 | $37,480 |
| 2018 | $1,984 | $53,730 | $16,250 | $37,480 |
| 2017 | $2,737 | $53,730 | $16,250 | $37,480 |
| 2016 | $2,716 | $53,730 | $16,250 | $37,480 |
| 2015 | $2,651 | $53,730 | $16,250 | $37,480 |
| 2014 | $2,601 | $53,730 | $16,250 | $37,480 |
Source: Public Records
Map
Nearby Homes