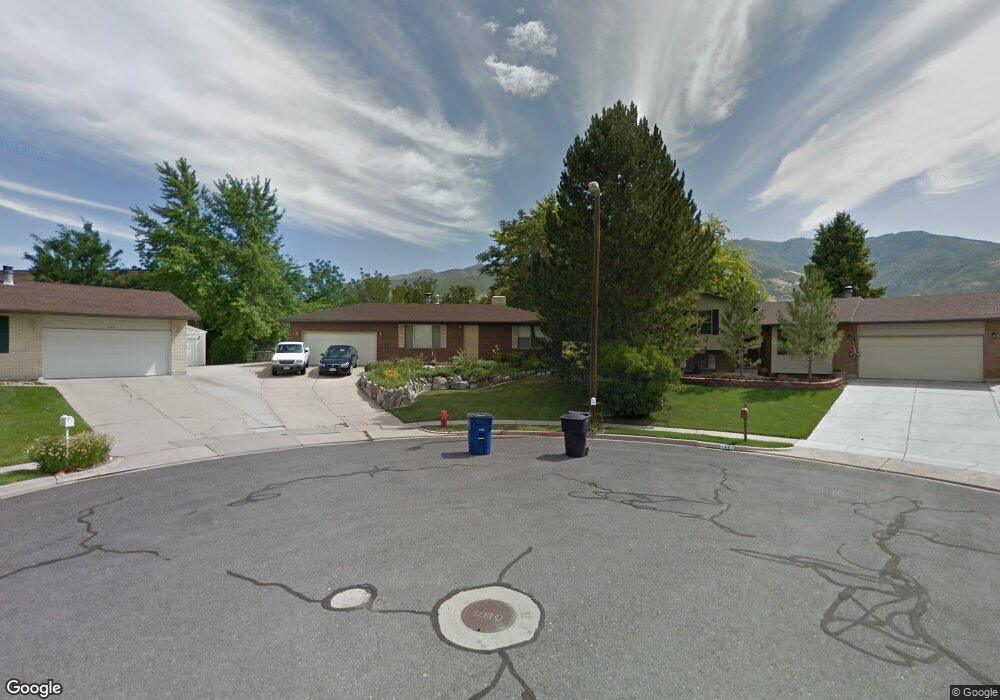
653 E 1400 S Kaysville, UT 84037
Estimated Value: $508,000 - $589,000
4
Beds
3
Baths
2,025
Sq Ft
$271/Sq Ft
Est. Value
About This Home
This home is located at 653 E 1400 S, Kaysville, UT 84037 and is currently estimated at $549,153, approximately $271 per square foot. 653 E 1400 S is a home located in Davis County with nearby schools including Windridge Elementary School, Kaysville Junior High School, and Davis High School.
Ownership History
Date
Name
Owned For
Owner Type
Purchase Details
Closed on
Oct 4, 2017
Sold by
Fox Run Investments Llc
Bought by
Michael Ryan and Michael Julane
Current Estimated Value
Home Financials for this Owner
Home Financials are based on the most recent Mortgage that was taken out on this home.
Original Mortgage
$10,000
Outstanding Balance
$8,324
Interest Rate
3.78%
Mortgage Type
New Conventional
Estimated Equity
$540,829
Purchase Details
Closed on
Jul 1, 2009
Sold by
Orison Randy M and Orison Shauna
Bought by
Fox Run Investments Llc
Purchase Details
Closed on
Mar 20, 2007
Sold by
Fox Run Investments Llc
Bought by
Orison Randy and Orison Shauna
Purchase Details
Closed on
Jan 25, 2007
Sold by
Orison Randy M and Orison Shauna
Bought by
Fox Run Investments Llc
Purchase Details
Closed on
Jul 21, 1999
Sold by
Anderson Camron C and Anderson Lesa W
Bought by
Orison Randy M and Orison Shauna D
Create a Home Valuation Report for This Property
The Home Valuation Report is an in-depth analysis detailing your home's value as well as a comparison with similar homes in the area
Home Values in the Area
Average Home Value in this Area
Purchase History
| Date | Buyer | Sale Price | Title Company |
|---|---|---|---|
| Michael Ryan | -- | Backman Title | |
| Fox Run Investments Llc | -- | None Available | |
| Orison Randy M | -- | None Available | |
| Orison Randy | -- | None Available | |
| Fox Run Investments Llc | -- | None Available | |
| Orison Randy M | -- | Associated Title Company |
Source: Public Records
Mortgage History
| Date | Status | Borrower | Loan Amount |
|---|---|---|---|
| Open | Michael Ryan | $10,000 |
Source: Public Records
Tax History
| Year | Tax Paid | Tax Assessment Tax Assessment Total Assessment is a certain percentage of the fair market value that is determined by local assessors to be the total taxable value of land and additions on the property. | Land | Improvement |
|---|---|---|---|---|
| 2025 | $2,711 | $273,350 | $178,888 | $94,462 |
| 2024 | $2,564 | $262,350 | $186,110 | $76,240 |
| 2023 | $2,557 | $463,000 | $319,834 | $143,166 |
| 2022 | $2,578 | $264,000 | $157,524 | $106,476 |
| 2021 | $2,394 | $367,000 | $211,158 | $155,842 |
| 2020 | $2,175 | $324,000 | $150,177 | $173,823 |
| 2019 | $2,161 | $316,000 | $113,165 | $202,835 |
| 2018 | $1,958 | $285,000 | $102,878 | $182,122 |
| 2016 | $1,722 | $131,230 | $37,205 | $94,025 |
| 2015 | $1,489 | $107,745 | $3,767 | $103,978 |
| 2014 | $1,410 | $103,822 | $37,205 | $66,617 |
| 2013 | -- | $88,000 | $37,883 | $50,117 |
Source: Public Records
Map
Nearby Homes
- 1241 S 700 E
- 529 E 1200 S
- 1372 Sweetwater Ln
- 1175 W 1875 N
- 1406 Swinton Ln
- 1883 Moss Ln Unit 236
- 975 E 1175 S Unit 32
- 975 E 1175 S Unit 42
- 557 E Warm Springs Dr
- 1647 W 1410 N
- 938 S Bristol Rd E Unit 50
- 1181 Set Ct Unit 2
- 696 W Emerald Oaks Dr N Unit 19
- 663 W Emerald Oaks Dr N Unit 17
- 666 W Emerald Oaks Dr N Unit 18
- 49 E 550 S
- 926 N 1875 W
- 1090 N Shepard Creek Pkwy Unit 6
- 479 W Summit Ln
- 1048 N Shepard Creek Pkwy Unit 4